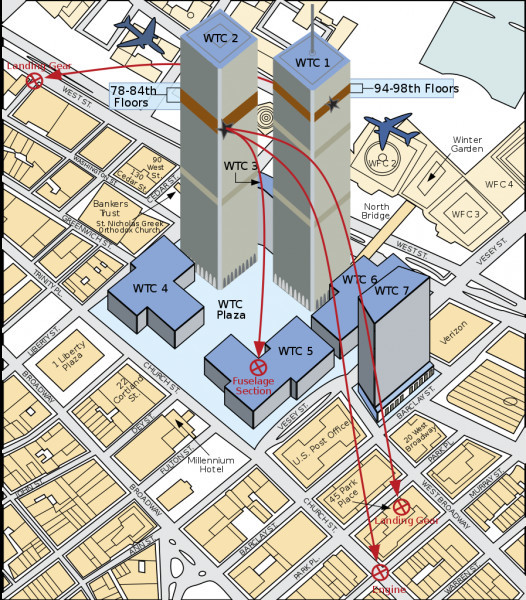
Figure 1.1 A three-dimensional depiction of the World Center complex (FEMA, 2002).
Risto Koivula, MSc (eng), researcher, Tampere.
https://hameemmias.vuodatus.net/lue/2018/09/palkin-vetoakestamattoman-liitoksen-siirtymaparametrit
http://www.metallirakentamisentutkimuskeskus.fi/site/_files/on%20the%20problem%20of%20bending.pdf
http://rmseura.tkk.fi/rmlehti/1985/nro4/RakMek_18_4_1985_4.pdf
http://books.google.fi/books?id=a0rHcmOHdAYC&pg=PA869#v=onepage&q&f=false
https://hameemmias.vuodatus.net/lue/2015/09/wtc-tower-were-not-demolished-with-explosives
***
Project Dates
May 1, 2015 - December 31, 2019
This is a study of the collapse of World Trade Center Building 7 (WTC 7) — a 47-story building that suffered a total collapse at 5:20 PM on September 11, 2001, following the horrible events of that morning. The objective of the study was threefold:
(1) Examine the structural response of WTC 7 to fire loads that may have occurred on September 11, 2001;
(2) Rule out scenarios that could not have caused the observed collapse; and
(3) Identify types of failures and their locations that may have caused the total collapse to occur as observed.
The UAF research team utilized three approaches for examining the structural response of WTC 7 to the conditions that may have occurred on September 11, 2001.
First, we simulated the local structural response to fire loading that may have occurred below Floor 13, where most of the fires in WTC 7 are reported to have occurred.
Second, we supplemented our own simulation by examining the collapse initiation hypothesis developed by the National Institute of Standards and Technology (NIST).
Third, we simulated a number of scenarios within the overall structural system in order to determine what types of local failures and their locations may have caused the total collapse to occur as observed.
The principal conclusion of our study is that fire did not cause the collapse of WTC 7 on 9/11, contrary to the conclusions of NIST and private engineering firms that studied the collapse.
The secondary conclusion of our study is that the collapse of WTC 7 was a global failure involving the near-simultaneous failure of every column in the building.
RK: This fake "research" does not critisize this real NIST´s simulation on WTC-7´s collapse:
https://www.youtube.com/watch?v=fIAK6PAeyn8
NIST´S FINAL REPORT:
IN THE NEW RESEARCH THE STIFFNESS OF CRITICAL COLUMN 79 IS CALCULATED IN ITS ORIGINAL SUPPORT CONDITION, WHICH LEADS TO ERRONEOUS RESULTS. THE STRUCTURAL SYSTEM WAS PLANNED TO COLLAPSE ON FOOTPRINTS IF IT COLLAPSES.
NEITHER THERE WOULD HAVE BEEN ANY "CRIME" IN EXLODIND EMPTY WTC-7 TO FALL ON FOOTPRINTS WITH ONE LARGE CHARGE AT THE CRITICAL COLUMN 79, WHEN IT HAD BURNED 7 HOURS.
THERE WOULD HAVE BEEN NO REASON TO HIDE, IF THAT HAD HAPPENED!
***
A Structural Reevaluationof the Collapse of World Trade Center 7
FINAL REPORT
Department of Civil and Environmental Engineering Col-lege of Engineering and Mines Institute of Northern Engi-neering University of Alaska Fairbanks Fairbanks, AK 99775
Prepared for: Architects &E ngineers for 9/11 Truth
INE Report 18.17 March 2020
ABSTRACT
A Structural Reevaluation of the Collapse of World Trade Center 7 By

J. Leroy Hulsey, (1941 -) Ph.D., P.E., S.E., University of Alaska Fairbanks And

Zhili Quan,Ph.D.,Bridge Engineer South Carolina Department of Transportation And

Feng Xiao,Ph.D.,Associate Professor Nanjing University of Science and Technology Department of Civil Engineering (left the "research" group 2016)
This report presents the findings and conclusions of a four-year study of the collapse of World Trade Center Building 7 (WTC 7) — a 47-story building that suffered a total collapse at 5:20 PM on September 11, 2001, following the horrible events of that morning. The objective of the studywas threefold:
(1) Examine the structural response of WTC 7 to fire loads that may have occurred on September 11, 2001;
(2) Rule out scenarios that could not have caused the observed collapse; and
(3) Identify types of failures and their locations that may have caused thetotal collapse to occur as observed.
The UAF research team utilized three approaches for examining the structural response of WTC 7 to the conditions that may have occurredon September 11, 2001.
First, we simulated the local structural response to fireloading that may have occurred below Floor 13, where most of the fires in WTC 7 are reported to have occurred.
Second, we supplemented our own simulation by examining the collapse initiation hypothesis developed bythe National Institute of Standards and Technology(NIST).
Third, we simulated several scenarios within the overall structural system in order to determine what types of local failures and their locations may have caused the total collapse to occur as observed.
The principal conclusion of our study is that fire did not cause the collapse of WTC 7 on 9/11, contrary to the con-clusions of NIST and private engineering firms that studied the collapse.
The secondary conclusion of our study is that the collapse of WTC 7 was a global failure involving the near-simultaneous failure of every column in the building. All input data, results data, and simu-lations that were used or generated during this study are available at
RK: The collapse was immediately caused by loss of lateral support of the columns due to breaking of the stiffeninng system of the building by outer walls and floors by fall of floor elements (left from girder line 26 - 44) butting to one outer wall 28 - 42 under 12. etage level.
WTC7´s: floor strucure:
http://www.nist.gov/el/disasterstudies/wtc/faqs_wtc7.cfm

Diagram 1 - Typical WTC 7 floor showing locations of columns (numbered). The buckling of Column 79 was the initiating event that led to the collapse of WTC 7. The buckling resulted from fire-induced damage to floors around column 79, failure of the girder between Columns 79 and 44, and cascading floor failures. (Credit: NIST)
The unsupported Column 79 then buckled and triggered an upward progression of floor system failures that reached the building's east penthouse. What followed in rapid succession was a series of structural failures. Failure first occurred all the way to the roof line — involving all three interior columns on the easternmost side of the building (79, 80, and 81). Then, progressing from east to west across WTC 7, all of the columns failed in the core of the building (58 through 78). Finally, the entire façade collapsed.
The probable collapse sequence is described in NIST NCSTAR Report 1A, Section 2.4 and NIST NCSTAR Report 1-9, Chapter 13.
FR: " iii EXTERNAL PEER REVIEWERS
Gregory Szuladzinski, Ph.D
Chartered Consulting Engineer Analytical Service Company
(Only "Tuther" publictions and one collection of formulas in impact mechanics Formulas for Mechanical and Structural Shock and Impact .
Robert Korol, Ph.D Emeritus Professor of Civil Engineering McMaster University
ACKNOWLEDGEMENTS
We would like to thank Dr. Larry Hinzman, Vice Chancellor for Research, University of Alaska Fairbanks (UAF),for his encourage-ment and support and Marmian Grimes, Senior Public Information Officer, for her efforts to bring our research findings to the public.
We would also like to thank the College of Engineering and Mines, the Department of Civil and Environmental Engineering (CEE), and the Institute of Northern Engineering (INE) at the University of Alaska Fairbanks.In particular, we would like to thank the school for providing the graduate student support that was instrumental in conducting this research.
We would also like to thank the personnel at INE for their help and encouragement. We especially want to thank Sandra Boatwright (Proposals and Publications Mana-ger); Kathy Peterson (Grant Manager); Joan Welc-Le-Pain (Proposal Coordinator); Joel Bailey (Research Professional) for his IT support; and Melanie Rohr (Web Designer) for her postingthe work on the INE website.
In addition to the university and its personnel,we would like thank Architects & Engineers for 9/11 Truth (AE911Truth) for providing the funding to conduct this research. We also want to thank John Thiel for approaching Dr. Hulsey to conduct this research. We also want to thank independent, external reviewers and the public who provided comments during a two-month review period.
DISCLAIMER
This document is disseminated under the sponsorship of Archi-tects & Engineers for 9/11 Truth, in the interest of information ex-change. Architects & Engineers for 9/11 Truth assumes no liability for use of the information con-tained in this document. Architects & Engineers for 9/11 Truth does not endorse products or manufactu-rers. Trade-marks or manufacturers’ names appear in this report only because they are considered essential to the objective of the document. Opinions and conclusions expressed or implied in the report are those of the authors. They are not necessarily those of the funding agency.
iv TABLE OF CONTENTS
ABSTRACT
ii EXTERNAL PEER REVIEWERS
III ACKNOWLEDGEMENTS
iiiDISCLAIMER
iiiLIST OF FIGURES
vi LIST OF TABLESxii EXECUTIVE SUMMARY
1 CHAPTER
1.0 INTRODUCTION.......................................................... 8
1.1 Background................................................................ 8
1.2 Objective................................................................. ..13
1.3 Literature Review and Interpretation of Drawings. ... 13
1.4 Previous Studies of WTC 7’s Collapse............. ........ 16
1.4.1 Federal Emergency Management Agency, May 2002..16
1.4.2 National Institute of Standards and Technology, November 2008 .........................................17
1.4.3 Arup and Nordenson, April 2010........................ ...20
1.4.4 Weidlinger, October 2010 .............................. ...... 21
1.5 The UAF Team’s Approach to Examining the Structural Response of WTC7 .................... ..................... 21
1.5.1 Approach 1: Structural Response to Fire Loading 21
1.5.2 Approach 2: Evaluation of NIST’s Collapse Initiation Hypothesis ....................... ........ ..........22
1.5.3 Approach 3: Simulating the Collapse of WTC 7.... 23
CHAPTER 2.0
STRUCTURAL RESPONSE TO FIRE LOADING ........ ... 24
2.1 Process Overview.................................. ............... .... 24
2.1.1 Software Tools and Uses ........................ ...............24
2.1.2 General Outline of the Study..................... .......... 24
2.1.3 Background Studies...................................... ....... 26
2.2 Solid Works Modeling .......................... ......... ......... 32
2.3 Column 79 Buckling Analysis ...................... .......... 37
2.4 SAP2000 Modeling ............................................. ...... 39
2.4.1 Structural Steel Framing and Bracing Models ..... 39
2.4.2 Floor Slab Sub-models .............................. ........... 45
2.5 ABAQUS Modeling .......................................... ......... 49
2.5.1 Floors 12 and 13 ABAQUS Model................... ...... 50
2.5.2 Structural Steel Connections Using ABAQUS.. .... 52
2.6 WTC 7 Structural Response to Fire Loading ............ 63
2.6.1 SAP2000 Thermal Deformation Analysis ............ 64
2.6.2 ABAQUS Analysis.............................................. .... 68
2.7Summary and Conclusion................................ .. ...... 73
CHAPTER 3.0
EVALUATION OF NIST’S COLLAPSE INITIATION HYPOTHESIS ... .. ............................ 75
3.1 Methodology and Modeling Assumptions......... ......75
3.1.1 NIST’s Modeling Assumptions Used by UAF Team 75
3.2 Evaluation and Discussion of NIST’s Collapse Initiation Hypothesis 77
3.2.1 Girder A2001 Trapped by Side Plate......... ... ......77
3.2.2 Girder A2001 Web Stiffeners Prevent Flange Failure and Girder Walk-off .......... ......... 80
3.2.3 Lateral Support Beams Prevent Beam Buckling 83
3.3 Evaluation of the Arup and Nordenson Collapse Initiation Hypothesis ........................ ... 87
3.3.1 Discussion of Arup and Nordenson’s Analysis ...87
3.4 Evaluation of the Weidlinger Collapse Initiation Hypothesis ............................ ................. 91
3.4.1Discussion of Weidlinger’s Collapse Initiation Hypothesis .. .......................... ...................91
CHAPTER 4.0 SIMULATING THE COLLAPSE OF WTC 7. 92
4.1 Key Features of the Collapse ............................... .. 92
4.1.1 Discussion of NIST’s Progressive Collapse Simulation .......................................................... 92
4.2 The UAF Research Team’s Approach......... ..... ....... 94
4.2.1Hypothetical Failure Mechanisms for the East Penthouse Collapse ...................... ....94
4.2.2 Hypothetical Failure Mechanisms for West Penthouse and North Face Roofline Collapse .............. .... .............95
4.3 Results of the East Penthouse Collapse Analyses.. 95
4.4 Linear and Dynamic Analytical Methods..... ...... 99
4.5 Results from Analysis of NIST’s Horizontal Core Column Failure Scenario .......... ........ .... 99
4.6 Results of Core Column/Exterior Column Failure Analysis .. ........................... ..........105
4.7Summary and Conclusion .................. .................. 109
REFERENCES....................... .................................... 111
EXECUTIVE SUMMARY
This report presents the findings and conclusions of a four-year study of the collapse of World Trade Center Building 7 (WTC 7) - a 47-story building that suffered a total collapse at 5:20 PM on September 11, 2001, following the horrible events of that morning. Figure E.1 showsthe layout of WTC7 in relation to the World Trade Center complex prior to Sep-tember 11, 2001. Figure E.2 shows the structural layout of Floor 13. Figure E.3 shows the finite element model of WTC 7. Thisstudy was conductedby a three-person team of re-searchers at the University of Alaska Fairbanks (UAF) De-partment of Civil and Environmental Engineering with fun-ding provided by Architects&Engineers for 9/11 Truth, Inc., a 501(c)(3) nonprofit organization whose purpose is to con-duct research and educatethe public about the World Trade Center building collapses on 9/11.
According to the National Institute of Standards and Tech-nology (NIST) — an agency of the U.S. Department of Com-merce that in-vestigated the three building failures on 9/11 — the collapse of WTC 7 was the first known instance of the total collapse of a tall building primarily due to fires.
However, many independent researchers have studied the collapse of WTC 7 and assembled a body of evidence that raises questions about the validity of NIST’s conclusions.
The objective of this study, therefore, was threefold:
(1) Examine the structural response of WTC 7 to fire loads that may have occurred on September 11,2001;
(2) Rule out scenarios that could not have caused the observed collapse; and
(3) Identify types of failures and their locations that may have caused thetotal collapse to occur as observed.
The UAF research team utilized three approachesforexamining the structural responseof WTC 7 to the conditions that may have occurred on September 11, 2001.
First, we simulated the local structural response to fire loa-ding that may have occurred below Floor 13, where most of the fires in WTC 7 are reported to have occurred.
Second, we supplemented our own simulation by exami-ning the collapse initiation hypothesis developed by NIST.
We also reviewed the collapse initiation hypotheses advanced by private engineering firms whose studies were commissioned as part of litigation related to the collapse of WTC 7.
Third, we simulated severalscenarios within the overall structural systemin orderto determine what types of local failures and their locations may have caused the total collapse to occur asobserved.
Before conducting a thorough and detailed evaluation of building response due to fire 2 and other issues, we exa-mined the building condition following failure of the World Trade Center Buildings 1 and 2. Some debris impact da-mage is reported to have occurred at the lower southwest corner of the building,which we accounted for in simulating thebuilding response.
3 Fire Did Not Cause the Collapse of WTC 7
The principal conclusion of our study is that fire did not cause the collapse of WTC 7on 9/11, contrary to the con-clusions of NIST and private engineering firms that studied the collapse. "
RK: NIST HAS NOT STATED THAT FIRE IMMEDIATELY CAUSED BUCKLING OF COLUMNS.
That is a straw man argument.
FR: " This conclusion is based upon a number of findings from our different analyses.
Together,they show that fires could not have caused weakening or displacement of structural members capable of initiating any of the hypothetical local failures alleged to have triggered the total collapse of the building,
nor could any local failures, even if they had occurred, have triggered a sequence of failures that would have resulted in the observed total collapse. "
RK: This latter is not true.
FR: " Near-Simultaneous Failure of Every Column Explains them Collapse
The secondary conclusion of our study is that the collapse of WTC 7 was a global failure involving the near-simulta-neous failureof every column in the building. This conclu-sion is based primarily upon the finding that the simulta-neous failure of all core columns over 8 stories followed 1.3 seconds later by the simultaneous failure of all exterior co-lumns over 8 stories produces almost exactly the behavior observed in videos of the collapse, whereas no other sequ-ence of failures that we simulated produced the observed behavior. We cannot completely rule out the possibility that an alterna-tive scenario may have caused the observed col-lapse; however, the near-simultaneous failure of every co-lumn is the only scenario we identified that was capable of producing the observed behavior.
Key Findings Upon Which the UAF Team’s Conclusions Are Based
Approach 1 Findings
•During our nonlinearconnection study(Section 2.1.3.2), we discovered that NIST over-estimated the rigidity of the out-side frame by not modeling its connections,essentially treating the exterior steel framing as thermally fixed, which caused all thermallyinduced floor expansion to move away from the exterior. The exterior steel fra-ming was actually flexible, while the stiffest area resistant to thermal move-ments, i.e., the point of zero thermal movement, was near the elevator shafts.
•Therefore, during our analysis of WTC 7’s response to fire-loading (Section 2.6),we found the overall thermal move-ments at the A2001 base plate support near Column 79 4 were not sufficient to displace girder A2001 to the point that it walked off its seat(the initiating failure alleged by NIST). Whereas NIST asserted that the differential westward displacement of girder A2001 relative to Column 79 was 5.5 inches and laterr evised its calculation to 6.25 inches, we found that the westward displacement of girder A2001 relative to Column 79 would have been less than 1inch under the fire conditions reported by NIST.
Approach 2 Findings
Under our second approach,we used a solid element model to evaluate the validity of NIST’s collapse initiation hypo-thesis, introducing a number of assumptions made by NIST that we considered to be invalid or, at best, questionable (Section 3.1).
These assumptions included assuming the east exterior wall to be rigid andt hermally fixed, assuming shear studs on several beams were broken due to differential thermal movement, assuming no shear studs were installed on girder A2001, and assuming that the bolts fastening girder A2001 to its seats at Columns 44 and 79 were broken (Section 3.1.1).
Allowing forthese overly generous assumptions, we found the following:
•When girder A2001 is heated to the temperatures assu-med by NIST, it expands such that it becomes trapped be-hind the side plate on the western side of Column 79 as it is pushed to the west by thermally expanding floor beams.
This prevents the girder’s web from traveling beyond the bearing seat, thus preventing the girder from walking off its seat (Section 3.2.1).
• NIST, by its own admission, did not include the partial height web stiffeners known to be on girder A2001. In addition to stiffening the web, these stiffeners significantly increase the bending resistance of the flange. In a subsequent analysis where we removed the side plate described in the previous paragraph in order to allow for further westward travel of girder A2001, we found that the stresses in the girder flange and stiffener would not be sufficient to cause the flange to fail, thus preventing the girder from walking off its seat (Section 3.2.2).
• In a preliminarycollapse initiation hypothesis, NIST posited that beam G3005 buckled because its thermal expansion was restrained by girder A2001. We found that this can 5 happen only when the three lateral support beams S3007, G3007, and K3007 spanning from beam G3005 to the north exterior wall are not included in the model.
While these short beams are observed in some of the figures in the NIST report,they are missing from the model(s) used in the thermal and structural analysis shown in the report(Section 3.2.3).
Separate from the NIST investigation, two studies of WTC 7’s col-lapse were commissioned by opposing sides in the lawsuit “Aegis Insurance Services, Inc. v. 7 World Trade Center Company, L.P.”
Experts working in connection with engineering firms Ove Arup & Partners (Arup) and Guy Nordenson and Associates (Nordenson) were retained by the plaintiffs. The enginee-ring firm Weidlinger Associates Inc. (Weidlinger) was retained by the defendants.
After evaluating NIST’s collapse initiation hypothesis, we reviewed the Arup, Nordenson, and Weidlinger reports and found the following:
• Arup’s finite element analysis corroborates our finding that girder A2001 would become trapped behind the western side plate of Co-lumn 79. However, Arup’s analysis then goes on to contend that the five beams to the east of girder A2001 were heated enough to sag and pull the girder to the east and offits seat. Putting aside whether this initiating mechanismis valid, we found that Nordenson in cor-rectly calculated the impact force of the falling girder by considering it as a point load, thus implying an infinite stiffness and no deflec-tion. Calculating the impact force correctly, we found that it is less than 10% of the 632,000 lb. force requi-red to shear the girder bea-ring seat support welds at Floor 12. Therefore, the northeast corner of Floor 12 would not have collapsed if the Floor 13 girder came off its seat at Column 79, and a cascade of floor failures would not ensue.
• The Weidlinger report was prepared as a rebuttal to the Arupand Nordenson reports. Among its points of rebuttal, it corroborates our finding that the falling Floor 13 beam and girder assembly could not break through Floor 12.
The Weidlinger report contends instead that Floors 9 and 10 were simultaneously heated to between 750° and 800°C in the exact same area of each floor, eventually causing those floors to fail and triggering a cascade of floor failures down to Floor 5.
However, the details of the thermal analysis are not shown in the Weidlinger report, and the thermal analysis has not been made public. It 6is important to understand that steel structural members reaching temperatures of 750°C due to office fires can be consi- dered extraordinary. Without any analysis provided to substantiate such temperatures, Weidlinger’s collapse initiation hypothesis must beviewed skeptically and canbe assumed to have a very low probability of occurrence (Section 3.4.1).
http://journalof911studies.com/letters/h/Report_on_Weidlinger.pdf
Approach 3 Findings
Under our third approach, we simulated a number of hypothetical scenarios in order to determine what types of local failures and their locations may have caused thetotal collapse to occur as observed. Based upon a series of analyses, we found the following:
•Columns 79, 80, and 81 did not fail at the lower floors of the building, as asserted by NIST. "
RK: This is a lie.
FR: " In order to allow for the observed collapse of the east pent-house approximately 7 seconds prior to the collapse of the rest of the structure, these columns needed to have failed at the upper floors of the building all the way to the penthouse. Yet there were no documented fires above Floor 30.
Therefore, fire did not cause the collapse of Columns 79, 80, and 81 nor the collapse of the east penthouse (Section 4.3).
•The hypothetical failure of Columns 79, 80, and 81 — the three easternmost core columns — would not trigger a horizontal progression of core column failures. "
RK: This is a lie.
FR: " Therefore, the hypotheses of NIST, Arup/Nordenson, and Weidlinger that the buckling of Column 79 could trigger a progres-sive collapse of the entire building are invalid, and the collapse of Columns 79, 80, and 81 high in the building was a separate and distinct event (Section 4.5). "
RK: That is not a progressive but a bunch buckling.
The fall of floor elements under 12. floor is progressive: one drops another. It is absolutely impossible to "prove" for severe damaged, burned construction, that "such can not have happened", as these quack scintists try to do.
The later fall of floor elements upper to 12. floor was not progressive, too, but simultaneous due to buckling of line 26-44 colums
FR: " • Even if we assume the failure of Columns 79, 80, and 81 could lead to the failure of the next row of core columns, the hypo-thetical failure of Columns 76 to 81 would over-load the exterior co-lumns around the southeast of the building,rather than overloading the next row of core columns to the west, which would result in the building tipping to the southeast and notina straight-down collapse (Section 4.5). "
RK: THE COLLAPSE MECHANISM IS NOT "PROGRESSING OVERLOADING OF COLUMNS, BUT THEIR SMULTANEOUS LOSS OF LATERAL SUPPORT!!!
FR: • The simultaneous failure of all core columns over 8 stories followed 1.3 seconds later by the simultaneous failure of all exterior columns over 8 stories produces almost exactly the 7 behavior observed in videos of the collapse.
The collapse could have started at Floor 16 and below and produced the same behavior (Section 4.6).
It is our conclusion based upon these findings that the collapse of WTC7 was a global failure involving the near-simultaneous failure of all columnsin the building and not a progressive collapse involving the sequential failure of columns throughout the building.
8 CHAPTER
1.0 INTRODUCTION
1.1 Background
Three structural failures of unprecedented magnitude took place on September 11,2001,when World Trade Center (WTC) Buildings 1,2, and 7 each suffered total collapse at 10:28 AM, 9:59 AM, and 5:20 PM, respectively. Unlike the taller WTC1 and WTC2,WTC7 was not struck by an airplane.
The cause of WTC 7’s total collapse is the subject of the present study.
Completed in 1986, WTC 7 was a 47-story building with a steel frame and reinforced concrete floors.It was built overa pre-existing electrical substation, with its first three floors connected to the sub-station. Several functional alterations were made to WTC 7 over its lifetime,although these alterations were in the upper floors only and therefore not in the areas of the building that experienced sustained fires on September 11, 2001.
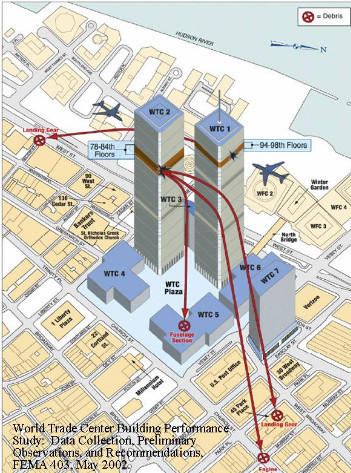
Figure 1.1 A three-dimensional depiction of the World Center complex (FEMA, 2002).
Unfortunately, efforts to investigatethe collapse of WTC 7were hampered by the swift removal and destruction of debris from the WTC site.
This type of evidence is typically preserved and available during any forensic investigation.
HM : "Only thing that went otherwise than planned in for this type of cases was,that people became trapped in the etages over stikes. In Finland buildings would have been illegal without outer exits. That was rule-maker´s, the government´s mistake. The towers stood the legal times under fire.
A crime of tecnical administration is sought, WHEN A CASE GOES ESSENTIALLY OTHERWISE THAN IT IS PLANNED to go.
9
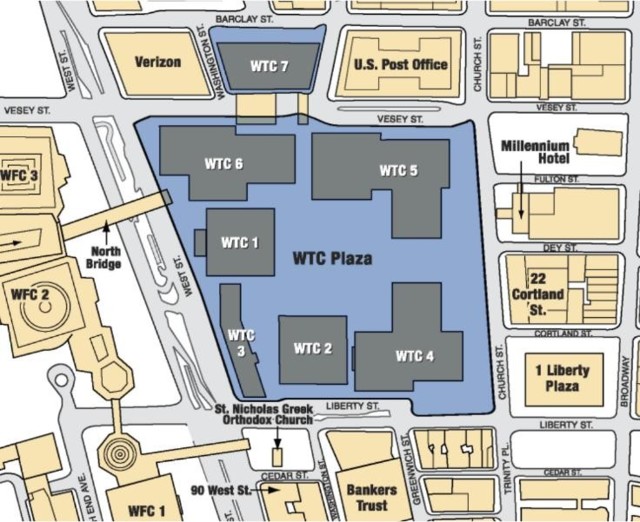
Figure 1.2 A plan view of the World Trade Center complex (FEMA, 2002).

Figure 1.3 WTC 7 seen from the north on September 11, 2001 (NYPD).
10

Figure 1.4 WTC 7 tenants on September 11, 2001 (FEMA, 2002).
Following the disaster,many in the engineering community hypothe-sized that the collapse of WTC 7 was caused by some combination of debris impact damage from the collapse of WTC 1 and the fires that subsequently burned in WTC 7 until its collapse. Different variations of this hypothesis were advanced by two federal investi-gations: the first by the Federal Emergency Management Agency (FEMA), which issued its final report in May 2002,and the secondby the National Institute of Standards and Technology (NIST),which is- sued its final 11 report in November 2008. NIST ultimately conclu-ded that the collapse of WTC 7 was the first known instance of the total collapse of a tall building primarily due to fires.

Figure 1.5 The collapse of WTC 7 at 5:20 PM (source unknown).
Concurrent to and since the NIST investigation, many inde-pendent researchers have also studied the collapseof WTC 7and assembled a body of evidence that raises questions about the validity of NIST’s conclusions. That evidence includes the following:
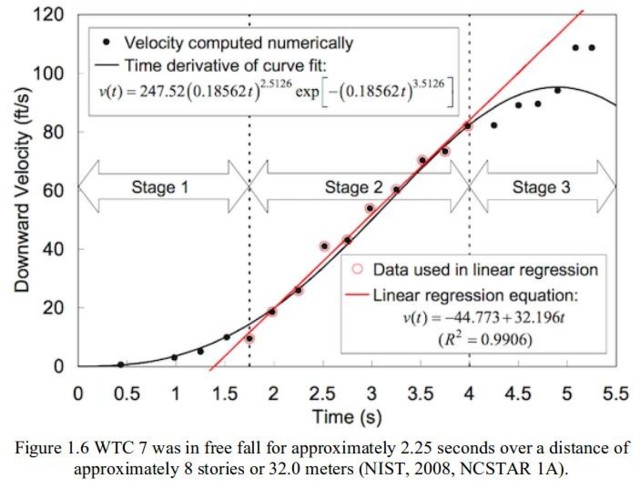
1. WTC 7 experienced between 2.25 and 2.5 seconds of free fall (i.e.,gravitational acceleration) during its collapse. This fact was first identified by independent researcher David Chandler and later cor-roborated by NIST (Figure 1.6). WTC 7’s free fall is note worthy be-cause,in a typical building collapse,WTC7 would be expected to ex-perience a combination of axial rotation and bending of members, resulting in a disjointed,asymmetrical collapse, at less than free-fall acceleration. Asymmetrical, tipping behavior is especially likely because WTC 7 did not have planar symmetry.
2. The debris pile of WTC 7 was contained mostly insidethe buil-ding’s footprint. Furthermore, itdidnothave large pieces of concrete flooring orintact structuralframing that would be expected in a building collapse (see Figure 1.7).
3. According to Appendix C of FEMA’s May 2002 report, a steel member recovered from WTC 7 was found to have experienced corrosion due to a combination of oxidation and sulfidation at 1000 °C, resulting in the formation of a liquid eutectic (see Figure 1.8). Researchers have hypothesized that the presence of thermate, which is aform of thermite 12 incendiary that includes sulfur, would explain the sulfidation and formation of a liquid eutectic (Jones, 2006 and 2007). These anomalies combined with the fact that there is no prior instance of a tall building undergoingtotal collapse due to fireledustoreevaluate the hypothesis of fire-induced failureforthe collapse of WTC 7.


1.2 Objective
The objective of thisstudy wasthreefold:
(1)Examine the structural response of WTC 7 to fireloads that may have occurred on September 11, 2001;
(2)Rule out scenarios that could not have caused the observed collapse; and
(3)Identify types of failuresand their locationsthat may have caused the total collapse to occur asobserved.
1.3 Literature Review and Interpretation of Drawings
The UAF research team conducted a wide-ranging literature review in order to gather the existing condition data for WTC 7. Documents assembled included information related to the foundation, structural steel members, construction methods,and various built-up columns used in the building.
In addition, we familiarized ourselves with the building design, alte-rations to the building design, the design of floor loads (dead and live), and the building’s lateral loads, such as wind and seismic. An extensive number of documents were made available by experienced researchers of WTC7’s collapse.
Figure 1.9 WTC 7 steel frame building geometry prior to its collapse (FEMA, 2002).
The UAF research team reviewed the steel erection drawings of WTC 7 in order to develop our simulation of the building prior to its collapse. These drawings included plan views showing the framing for 47 stories as well as numerous details related to the construction methods used for each floor. We then carefully prepared the geometry of the virtual structure two floors at a time using AutoCAD.
The digital drawings were checked against the steel erection drawings by all mem-bers of the research team to ensure quality control. The quality control-checked digi-tal AutoCAD geometry was then imported into the latest versions of both SAP2000 and ABAQUS, which are finite element programs.The two finite element programs were used to simulate and study the building’s structural response to various load conditions. Each program was used by a different researcher and the results were compared.
Figure 1.10 shows the framing plan view for Floors 12 and 13. The drawings are difficult to read because of the number of framing members shown on the drawing.
Figure 1.11 shows a zoomed-in view of the drawing in Figure 1.10. The view is of the core area for Floors 12 and 13.
Figure 1.12 shows the details of Column 79 at Floor 13, which illustrate that Column 79 was a built-up column.
1.4 Previous Studies of WTC 7’s Collapse
In addition to gathering documentation on the existing condition data for WTC 7, we reviewed the previous studies of WTC 7’s collapse. As mentioned above, there have been two government investigations of WTC7’s collapse.In addition,two studies were commissioned by opposing sides in the lawsuit “Aegis Insurance Services, Inc. v. 7 World Trade Center Company, L.P.” The conclusions of these investigations and stu-dies - each of which posit a different failure mode - are described below. We provide a longer description of NIST’s collapse initiation hypothesis and probable collapse sequence because it is the federal government’s established technical cause of WTC 7’s collapse and thus the focus of this study.
1.4.1 Federal Emergency Management Agency, May 2002 After 9/11, the American Society of Civil Engineers (ASCE) and FEMA deployed a volunteer team of engi-neers to study the performance of all buildings at the WTC site (FEMA,2002). In May 2002, FEMA pub-lished the World Trade Center Building Performance Study (FEMA, 2002). The purpose of the study was “to examine the damage caused by the events, collect data, develop an understanding of the response of each affected building, identify causes of observed behavior,and suggest studies that should be performed.”
The FEMA Report was inconclusive as to the cause of WTC 7’s collapse, but it pro-posed a number of scenarios for further investigation.Based on the fact that the east penthouse fell approximately 7 seconds before the rest of the building fell,the FEMA Report sugges- ted that the collapse initiated on the east side of the building on the interior,most likely at the transfer trusses between floors 5 and 7.FEMA also sugges-ted that there were not enough combustibles on these floors to sufficiently weaken the structural members.
Thus, FEMA hypothesized that diesel fuel stored in the lower levels of the building was somehow pumped and discharged through severed pipes and this somehow fed fires for several hours. The report noted that its best hypothesis had “only a low probability of occurrence” and that further investigation was needed. NIST would later rule out the diesel fuel hypothesis.
1.4.2 National Institute of Standards and Technology, November 2008 NIST began a more in-depth investigation into the collapse of WTC 1,WTC 2, and WTC 7 in August 2002. This effort was conducted under the mandate of the National Construction Safety Team Act (NCSTA), which was signed into law on October 1, 2002. NIST put its WTC 7 investigation on hold in 2005 to focus on completing its report on the col-lapse of WTC 1 and WTC 2 that year. Eventually, in November 2008, NIST released its final report on WTC 7 (NIST, 2008, NCSTAR 1A). Below is a moderately detailed description of NIST’s collapse initiation hypothesis, which will be examined in the following chapters.
1.4.2.1 Floors with Fires The NIST report provides photographic evidence of fires oc-curring on Floors 7 to 9, 11 to 13, 19, 22, 29, and 30 (NIST, 2008, NCSTAR 1A). The report states that fires on the four upper floors (19, 22, 29, and 30) were of relatively short duration and inconsequential in terms of causing the collapse. The NIST report claims that the fire on the 12th floor in the northeast corner of the building was pri-marily responsible for initiating the collapse by causing heat-induced failures of the 13th floor structure.
1.4.2.2 Girder A2001 failure due to beam expansion NIST claims that five beams (K3004, A3004, B3004, C3004, and G3005) to the east of girder A2001 between Co-lumns 44 and 79 at Floor 13 had their shear studs broken due to thermal expansion. NIST claims that thermal expansion then allowed these beams to expand in an unre-strained way against the girder, causing the beams to push the girder to the point where its web was past its seat at Column 79. NIST also claims that because of excessive movement of the girder with respect to the support seat at Column 79, the load was then transferred to the girder’s flange, which could not withstand that load in flexure. NIST claims that the girder flange subsequently folded upward, causing the girder and the beams it supported to fall onto the next floor down.
1.4.2.3 Preliminary hypothesis concerning girder A2001 In a preliminary hypothesis designed to determine whether the shear studs on the floor beams would fail, the NIST report posits that the northernmost of five beams to the east of the girder, beam G3005,buckled due to its thermal expansion being restrained by girder A2001. The beam was located about 4 feet from the girder’s north end at Column 44, which was situated bet-ween the flanges of Column 44 and could not translate in the east to west direction.
NIST posits that this buckling occurred due to the girder being stiffer laterally than the beam was axially. NIST posits that the buckling of beam G3005 then precipitated the buckling of the other beams to the east of the girder, causing girder A2001 to be rocked off its seats at columns 44 and 79 and allowing the girder to fall onto the next floor down.
1.4.2.4 Eight (8) floor cascade of girder failures causing Column 79 to lose lateral support and buckle Column 79 had girders framing into it from the north, south, and west. NIST claims that girder A2001 from the north walked off its bearing seat at Floor 13 and fell one story, along with the beams and the floor slab it supported at Floor 13. Although there is no described or apparent mechanism,NIST simply claims that this initial north girder failure at Floor 13 precipitated a collapse of the south girder framing into Column 79 at Floor 13, which NIST claims had previously buckled due to thermal expansion.This collapse of the south girder at Floor 13 is then alleged to have caused a cascade of floor failures on the south side of Column 79 down to the 5th floor. The west girders are said to have had their connections to Column 79 broken by thermal expansion earlier and then also collapsed at this time. There was no fire on the 10th floor, which means that heating could not have caused the west girder under the 11th floor to have lost its connection to Column 79. In this case, NIST claimed that the same girder under Floor 13 pushed Column 79 to the east enough to break the knife connection to Column 79 two stories below on the girder under the 11th floor. It is then alleged that this series of failures left Column 79 laterally unsupported from the south and west for 9 stories, causing it to buckle.
1.4.2.5 Collapse Propagation According to NIST, the buckling of Column 79 caused by the loss of lateral support over 9 stories triggered a progressive collapse of the entire building, starting with the subsequent buckling of nearby Columns 80 and 81, the sub-sequent collapse of the east penthouse above Columns 79, 80 and 81, and then a west-ward progression of core column failures that redistributed loads to the shell of exterior columns.
1.4.3 Arup and Nordenson, April 2010 Experts working in connection with enginee-ring firms Ove Arup & Partners (Arup) and Guy Nordenson and Associates (Norden-son) were retained by the plaintiffs in “Aegis Insurance Services, Inc.v.7 World Trade Center Company, L.P.” to perform structural analysis in support of the claim that the collapse of WTC 7 resulted from deficient design, thus making the defendants liable for the destruction of the electrical substation over which WTC 7 was built. The Arup and Nordenson reports, as they are referred to hereafter, were filed with the court in April 2010. The Arup report concluded that girder A2001 (the same girder that NIST reported was pushed off its seat by thermally expanding beams to the east of the gir-der) was actually pulled off its seat by the sagging of beams to the east of the girder.
The largest displacement of the beams east of girder A2001 was analyzed by UAF to be 3.2 inches in the gravitational direction in SAP2000.This girder walk-off, accor-ding to the Nordenson report, then caused the same cascade of floor failures and buckling of Column 79 reported by NIST. However, contrary to NIST’s findings, Nor-denson found that the alleged failure of other girder connections framing into Co-lumn 79 on lower floors,which was necessary along with the aforementioned cas-cade of floor failures in order for Column 79 to buckle, could not have been caused by thermal expansion.The Nordenson report instead put forth the idea that the welds of these girder connections failed due to stress raisers (cracking) caused by repeated heating and cooling cycles.
1.4.4 Weidlinger, October 2010
The engineering firm Weidlinger Associates Inc. (Weidlinger) was retained by the de-fendants in “Aegis Insurance Services,Inc. v.7 World Trade Center Company, L.P.” to perform structural analysis in support of their defense that the collapse of WTC 7 did not result from deficient design and was instead caused by the extraordinary events of September 11,2001. The Weidlinger report,as it is referred to hereafter, was com-pleted in October 2010 but was never filed with the court. The Weidlinger report was made public in June 2016.The Weidlinger report found fault with various aspects of the Arup and Nordenson reports, in particular with Nordenson’s alleged failure of girder connections at lower floors and with Nordenson’s analysis of the impact of the unseated girder on the floor below.The Weidlinger report noted that the impact of the unseated girder would not be sufficient to break through the floor below.The Weidlin-ger report instead postulated, based on fire modeling performed by Dr. Craig Beyler, that Floors 9 and 10 were simultaneously heated to between 750° and 800°C in the exact same area of each floor. This extreme heating eventually caused Floor 10 to give way and break through Floor 9,which was possible only because of the extreme heating of Floor 9.Weidlinger then claims that the falling debris from these initial floor failures was sufficient to cause a cascade of floor failures through the unheated floors down to Floor 5, diminishing the lateral support for Column 79 and two nearby columns, Column 80 and Column 81, thus causing the columns to buckle and trigger a progressive collapse of the entire building.
1.5 The UAF Team’s Approach to Examining the Structural Response of WTC 7
The UAF research team utilized three approaches for examining the structural res-ponse of WTC 7 to the conditions that may have occurred on September 11, 2001. The findings and conclusions of each approach are described in Chapters 2, 3, and 4 respectively.
1.5.1 Approach 1:
Structural Response to Fire Loading First, we modeled the structural framing and simulated the local structural response to fire loading that may have occurred below Floor 13. Several factors warranted extra technical examination:
a. WTC 7 was not symmetrical. Therefore, during collapse it would naturally sway towards the mass center for the floors. The mass center for the floors were initially evaluated and then used to examine the building’s response during collapse.
b. The lack of combustibles was critically examined, as was the idea that primary damage by fires could occur on floors where financial centers were located. The questions we addressed were: Would this type of business have paper lying around or would privacy be most important and therefore paper stock locked in a fireproof safe? Why was a fire in this building so significant?
c.We simulated fires in the building.The heat transfer characteristics for the steel fra-ming with and without fireproofing was examined.We also studied how fire may have interacted with the concrete floors (in the flutes) and between flutes. We examined the steel frame response where the drop-down ceilings (acoustical tile) were hung below the floor system. We also studied the thermal conductivity of the concrete floors and their interaction with the steel beams and girders that made up the floor systems. The worst case for structural response to fire was to consider steel members without fireproofing and this was subsequently used to evaluate structural response.
d. We prepared a detailed simulation of the floor slab connection to the beams and floor slab connection to the girders. These connections included non-composite (no shear connectors), fully composite case 1 (shear connectors between the floor slab and the girders only),fully composite case 2 (shear connectors between the concrete floor slab and both beams and girders), and a partially composite condition. We also simulated the connections between beams and girders, the connections between girders and columns,and the connections between beams and columns. These con- nection details are important as the connectivity significantly affects the structural response during fire and the deformation response due to self-weight and dynamic forces that occur during collapse.
1.5.2 Approach 2: Evaluation of NIST’s Collapse Initiation Hypothesis Second, we supplemented our own simulation by evaluating the validity of NIST’s collapse initi-ation hypothesis and probable collapse sequence. In particular,we focused on identi- fying aspects of NIST’s simulation that caused it to a reach a conclusion different from ours.
1.5.3 Approach 3: Simulating the Collapse of WTC 7
Finally, we simulated various scenarios within the overall structural system to determine what types of local failures and their locations may have caused the total collapse to occur as observed.
CHAPTER 2.0 STRUCTURAL RESPONSE TO FIRE LOADING
This chapter presents the analysis and findings of the UAF research team based on its finite element modeling and simulation of WTC 7’s structural response to fire loads.
2.1 Process Overview
2.1.1 Software Tools and Uses
The research team used AUTOCAD to create a virtual geometry for each floor and a three-dimensional depiction of the 47-story building based primarily on the erection drawings. We then imported the AUTOCAD data into ABAQUS and SAP2000 and used it to model the floor framing at the 12th and 13th floors separately in each prog-ram, while SAP2000 was later used to model all the floors for which we had floor plans. To ensure the accuracy and consistency of the results of the models, we compared the two-story modeling results in ABAQUS and SAP2000 by applying horizontal structural and heat loads.
Next, we developed ABAQUS nonlinear models of the connections. We then used both ABAQUS and SAP2000 to evaluate the fire damage to the floor framing at Floors 12 and 13. Wire elements for beams and girders and shell elements for concrete slabs were then used to simulate the interaction between the concrete floor and beams and girders using both ABAQUS and SAP2000.
In total, the 47story SAP2000 model had 39,978 joints, 44,507 frame elements, and 7,832 area elements. The number of SAP2000 frame elements for Floors 12 and 13 alone was 2,026 and the number of area elements was 4,390. In addition to using wire elements for the steel framing, we examined the floor expansion characteristics and response using ABAQUS solid elements (discussed in Chapter 3).
2.1.2 General Outline of the Study
The study was started in late spring of 2015. It was conducted by a three-member team comprising two Ph.D. students who have since graduated (Feng Xiao and Zhili Quan) and one professor as the principal investigator (J. Leroy Hulsey).
In the fall of 2016, Dr. Feng Xiao graduated with a Ph.D.and took a research position in Mississippi at the end of the year, reducing the research team to two members.
We began this study by formulating a quality control plan so that all work — in parti-cular, all details that could affect our findings — would be scientifically examined and subjected to logic tests based on “what-if(s).”
The research plan we formulated is presented below:
Step 1: Formulate a Quality Control Plan;
Step 2: Gather all available technical data;
Step 3: Prepare a constructed building simulation using AUTOCAD in three dimensions;
Step 4: Determine the mass center for Floors 12 and 13;
Step 5: Import the building geometry (AUTOCAD data) into ABAQUS and SAP2000;
Step 6: Examine the mechanical and thermal properties of the building materials, including:
a. The mechanical properties of the steel at moderate and high temperatures,
b. The steel thermal properties,
c. The probable aggregate type for concrete floors at the building site, and
d. The thermal properties of the concrete, once the aggregate type was established;
Step 7: Examine the influence of structural steel installation details on structural response, including:
a. The connections for beams and girders as well as girders and columns, using ABAQUS,
b. The thermal expansion of the floor system, using ABAQUS,
c. A non-composite floor system with no interface friction between the concrete floor and supporting members;
d. A non-composite floor system with friction between the concrete floor and supporting members; e. A partially composite floor system;
f. A composite floor system; and
g. The effectiveness of the installed shear connectors at girders and beams as well as the resistance of girders and beams without shear connectors when subjected to a fire load.
Step 8: Prepare a 3-dimensional SAP2000 computer model to simulate the erected steel building. Prior to evaluating possible modes of failure that could lead to the col-lapse of this building, we conducted quality control checks by simulating progressive collapses for steel building systems using both ABAQUS and SAP2000.
2.1.3 Background Studies
During this investigation, the research team studied several topics related to the col-lapse of WTC 7, including progressive collapse, nonlinear connection response, and heat transfer analysis through the concrete and steel floor system. The findings of these studies are briefly described in the following sections.
2.1.3.1 Progressive Collapse
Progressive collapse is a failure sequence where local failure leads to large-scale collapse in a structure (Lim, 2004). There are three types of local failures: material failure, buckling failure, and connection failure. Two types of propagation failure can occur: spread upwards and spread down-wards. Propagation failure might spread upwards and/or sideways through the removal of supports and the impairment of the stability of the immediately superincumbent and/or adjacent structure.It might spread downwards primarily as a result of the impact loads of falling debris (Mainstone, 1973).
Two types of approaches are used to simulate and evaluate progressive collapse. The direct design method uses the actual loads that initiate collapse of a primary structural member in order to evaluate whether collapse will be initiated.
The alternate load path method removes one or several major structural bearing ele-ments (i.e., introducing initiating damage) and analyzes the remaining structure to determine if this initiating damage propagates. The advantage of the alternate load path method is that it is independent of the initiating load, so the solution is valid for any type of hazard that causes member loss.
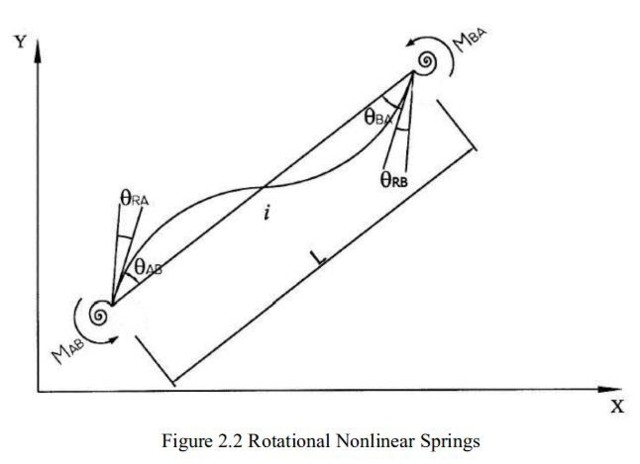
Four analysis methods may be used for progressive collapse: linear-elastic static analysis, nonli-near static analysis,linear-elastic dynamic analysis, and nonlinear dy- namic analysis. In progressive collapse analysis, a structure’s response is evaluated by starting with a simpler static metho-dology and then proceeding to increasingly complex analysis methods as necessary, until it is de-termined that the possibility of progressive collapse is low or until all available engineering methodologies are ex-hausted (Marjanishvili, 2004). In our study, axial nonlinear spring force-displacement curves were used to simulate shear, and rotational nonlinear springs were used to simulate a semi-rigid connection by using the moment-curvature relationship of a semi-rigid connection (see Figures 2.1 and 2.2).
Both a static analysis and a linear dynamic time history analysis using the direct in-tegration method were used to evaluate possible failure modes. We also checked this approach against a static non linear evaluation considering both geometric non-linearity and material nonlinearity; P-delta was not included in the analysis. Details are presented later in this chapter. Impact loading was examined, and the influence of neglecting impact loads had a minimal effect on our results.

28
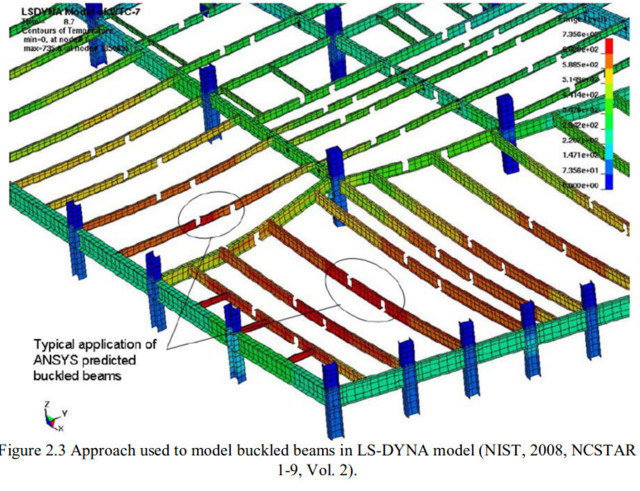
In the NIST investigation, ANSYS was used to model local failures and LS-DYNA was used to model large-scale collapse. When column buckling appeared to be imminent in ANSYS, the analyses were continued in the LS-DYNA 47-story model (NIST, 2008, NCSTAR 1-9, Vol. 2). The damage was applied in LS-DYNA as a sudden removal of damaged or failed elements as calculated in the ANSYS analysis.
Buckled beams were modeled by removing flange and web ele-ments,such that the beam would lose its axial and flexural strength, but the weight of the beam would remain in the calculation (see Figure 2.3).
The connection damage data from ANSYS was transferred to the LS-DYNA global model using a damage index. Horizontal support and vertical support were specified separately (see Figure 2.4 and Figure 2.5).

2.1.3.2 WTC7 Nonlinear Connection Study
Seven types of shear connections wereused for interior floor-framing connectionsin WTC 7:fin, header, knife, seated top plate, seated top clip, seated web clip and a seated moment connection (NIST, 2008, NCSTAR 1A). The exterior wind girders to exterior co-lumns were connected by using moment connections. Tied contacts are defined in the NIST Repor tas between the concrete deck and frames. No failure was allowed inthetied contact (NIST, 2008, NCSTAR 1-9A).
In the NIST investigation, the failures of the floor-framing connec-tions and the shear studs were modeled with break elements on Floors 8 to 14. Outside the selected areain Figure 2.5 shown below, structural damage - such as buckling of the steel frame and crush-ing and cracking of the concrete slab - was modeled over the entire floor, but connection failures were not modeled over the entire floor.
Connections were also not modeled in the exterior moment frame, as no failures were observed there prior to the onset of global collapse (NIST, 2008, NCSTAR 1A).
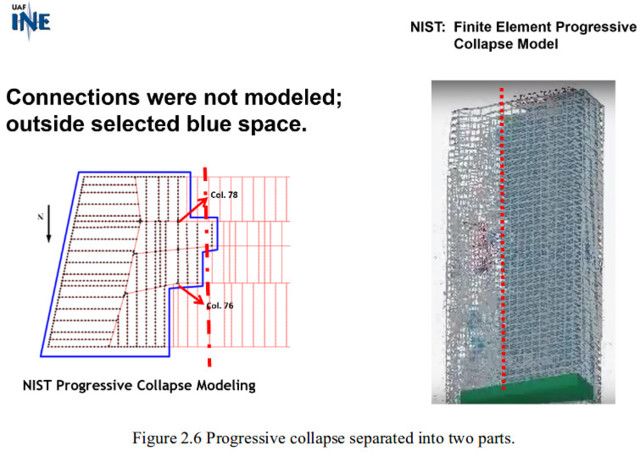
By not modeling connections in the outside frame,NIST overestima- ted the rigidity of the outside frame. That assumption and inconsis-tent modeling for the framing connections resulted in the stiffness of the east side of the building beingdifferent than that of the west side. This resulted in the stiffness being compromised across the plan of the building.The NIST simulation of the collapse illustrated that the west side of the buildingacted differently from the east side. The structural response to failure would more closely resemble the actual collapse if the connections had been accounted for through-out the structural frame. By not modeling the connection failures outside the selected area shown in Figure 2.5 above, NIST appears to have reduced the stiffness in the area outside the selected area and separated its progressive collapse simulation into two parts (see Figure 2.6).
The UAF teamused a consistent method for modeling the connec-tions in allfloor story modeling and included nonlinear deformation and failure behavior in the connections. The calculated nonlinear connections were defined in our building model by using rotational and axial nonlinear springs. It may be argued that pin connections may be stiffer than a spring and, in some cases, depending on loa-ding with moment transfer,it may be less stiff. In either case, not ac-counting for how the structure was built when evaluating a possible collapse is not appropriate.
2.1.3.3 Heat Transfer Analysis
Wealso reviewed the principle of heat transfer analysis. Heat trans-fer occurs between different physical systems at different tempera-tures. Thermal energy is always transferred from physical systems with high temperature to physical systems with low temperature and can be transferred by three different mechanisms: conduction, convection, and radiation.
Thermal conduction happens when different physical systems with different temperatures are in direct contact.
Thermal convection is the transfer of thermal energy due to bulk fluid movements.
Thermal radiation is the transfer of energy by the emission of electromagnetic radiation, which can happen without any medium between different physical systems.
The principle of heat transfer analysis is a key element in analyzing the collapse of WTC7 because it is crucial to determine the tempe-rature distribution of the structural elements - such as the girders and the concrete slabs - by analyzing the heat transfer from the fire to the structural elements.
2.1.3.4 Material Properties Utilized
A Portland cement mix was used for the concrete deck of WTC 7 to give a 3,500-psi concrete.The aggregate type was dolomite. The density was 145 pcf. The thermal expansion coefficient for the concrete deck was assumed to be 10.6 microstrain/°C.
Aggregate type has some effect on the coefficient of linear thermal expansion of concrete. However, the w/c (water–cement) ratio and cement content did not show any effect on the coefficient of thermal expansion (CTE) (Alungbe et al.,1992).Naik et al.(2011) proved that the source of dolomite aggregates had an insignificant effect on the CTE of concrete,with the CTE varying between 10.4 and 10.8 micro-strain/°C (from 5.8 to 6.0 microstrain/°F) and an overall average of 10.6 microstrain/°C (5.9 microstrain/°F).
The steel used for all beams and interior columns in WTC 7 was ASTM A572 Grade 50, and the steel used for exterior moment frames was ASTM A36. The thermal conductivity was 35 BTU / (hr-ft-F). The thermal expansion is reported to be the same for all typical structural steels (Rahman et al., 2004).
The CTE of steel is assumed to be constant,so that the thermal expansion strain is given by 14 microstrain/°C (7.78 microstrain/°F) (Wang, 2002).
2.2 Solid Works Modeling
Prior to conducting our analyses in SAP2000 and ABAQUS, we used SolidWorks to model a simulation of the thermal properties of the structural elements of WTC 7. As with our SAP2000 modeling, in order to obtain equivalent homogeneous shell elements repre-senting the floor slabs and to save computational time and resour-ces, effort was given to simulating the thermal equivalent material of the floor slabs.
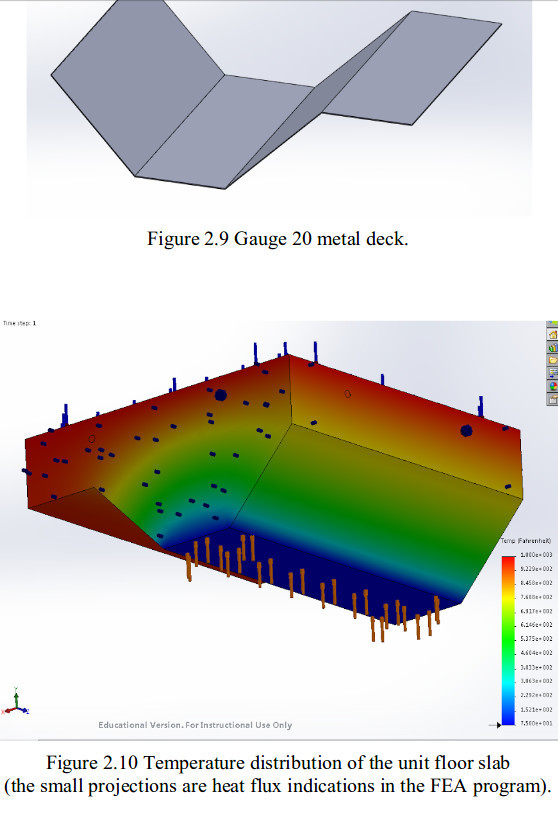
Figure 2.7, Figure 2.8, and Figure 2.9 show a small section of con-crete block with voids for reinforcing, welded wire fabric for the rein-forcement, and gauge 20 metal deck. The three models were then assembled into a unit section of the floor slab and assigned two dif-ferent surface temperatures, both at the top and at the bottom. The temperature distribution of the model is given in Figure 2.10 for steady-state analysis in Solid Works.

Next, a model was created in SolidWorks to simulate the floor slab. The geometry of the floor slab was the same, but the floor slab was modeled as a homogeneous material.
Figure 2.11 shows the equivalent homogeneous floor slab with the unassembled reinforced concrete slab of WTC 7, and Figure 2.12 shows the equivalent floor slab with the assembled reinforced conc-rete slab of WTC 7.Both models were assigned the same high tem- perature on the top surface and low temperature on the bottom sur-face. The stea-dy-state heat flux was then analyzed in SolidWorks (Figure 2.13).
The thermal conductivity of the equivalent homogeneous floor slab was modified to make the heat flux of the two models identical. The steel thermal conductivity used in the modeling was 35 Btu/(hr-ft-F); the concrete thermal conductivity was 1 Btu/(hr-ft-F). The thermal conductivity of the equivalent homogeneous material was deter-mined to be 1.28 Btu/(hr-ft-F), slightly higher than pure concrete’s thermal conductivity because of the steel element reinforcement.


In addition to modeling the equivalent thermal conductivity of the floor slabs, we modeled a simulation of the temperature distribution of the concrete, steel girders, and beams under elevated temperature.
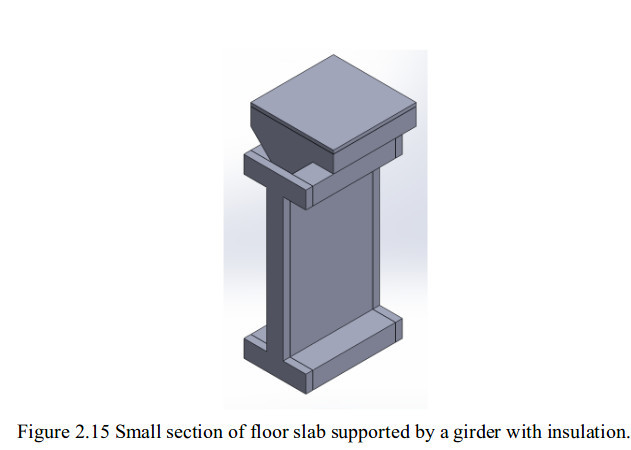
The elevated temperature was meant to represent the WTC 7 fire, and it could be time dependent. Figure 2.14 shows a small section of floor slab supported by a girder without insulation and Figure 2.15 shows a small section of floor slab supported by a girder with insulation. We studied the thermal boundary conditions after this portion of the study was complete. The thermal boundary condition includes the temperature assignment and heat loss condition.

2.3 Column 79 Buckling Analysis
According to NIST,the localfailurethat initiated the total collapse of WTC7 was that girder A2001 on Floor 13 at Column 79 was pushed off its support by the thermal expansion of the beams framing into it.
Therefore, we conducted a buckling analysis of Column 79 in order to better understand its performance when subjected to gravity and heat loads. Column 79 at Floor 13 was a built-up column consisting ofW14 730 and two steel plates 2 inches thick by 26 inches wide welded on the sides.
Figure 2.16 shows the cross section of Column 79.
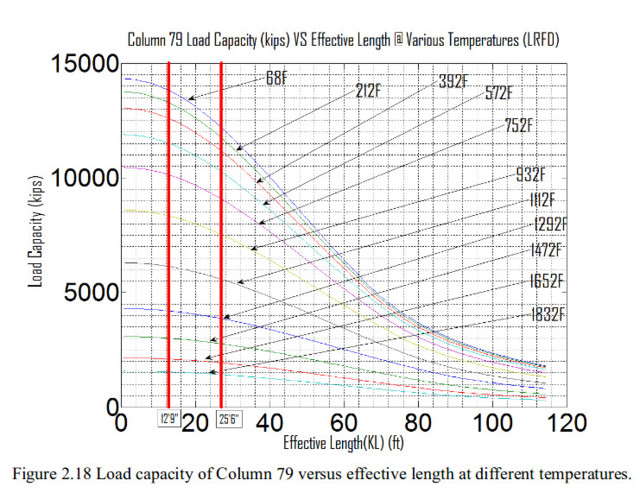
Figure 2.17 shows the mechanical properties of steel against temperature (Engineering tool box, 2011).
A buckling analysis was conducted for Column 79 according to the AISC Steel Construction Manual (AISC, 2011). Figure 2.18 shows the load capacity of Column 79 versus the effective length at diffe-rent temperatures assuming a pinned-pinned condition. The two red lines mark the effective length of 12 feet 9 inches and 25 feet 6 inches.The two effective lengths are the single floor height and the double floor height. The loading capacity of Column 79 at double floor height (25 feet 6 inches) would be the load capacity of the column during the fire if Column 79 were to lose its support on one floor. It is clear from Figures 2.17, 2.18 and Table 2.1 that the buck-ling load capacity was significantly higher than the acting load over a two-story unsupported length. Thus, a buckling failure due to vertical loading and heat caused by a fire could not have occurred."
RK: This is all bullshit: Columns 79, 80 and 81 have no lateral support in their girder line´s direction, when floor elements between that line and outer wall have fallen. It is Absolute use-less to calcute the colmns stiffnesses before that, it suports surely loads, - and AFTER that no kind of column would support in that position!
FR: " 37


2.4 SAP2000 Modeling
2.4.1 Structural Steel Framing and Bracing Models
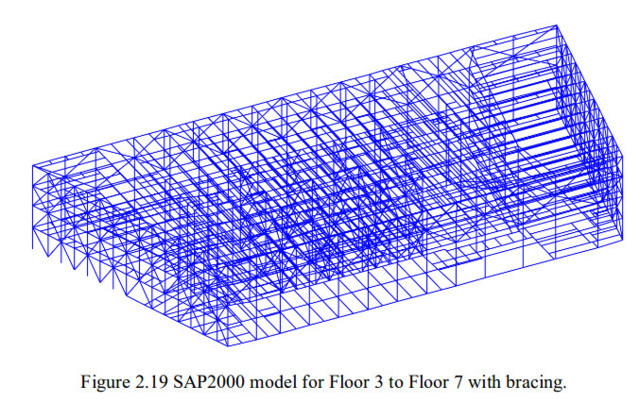
Different portions of WTC 7were modeled using SAP2000. First, we modeled Floor 1 to Floor 7.Modeling Floor 1 to Floor 7 was finished in combination with the bracing, both on the perimeter and in the core area. However, Floor 1 and Floor 2 could only be partially finished due to missing draw-ings for the electrical substation. The substation was two stories, and WTC7’s third floor became the roof of the sub-station when it was built over the substation. The sub-station’s roof was removed down to existing steel supports, and, presumably, new decking was integrated at the same level (33-ft 4- inches) and a slab was poured. Therefore, we used the roof of the substation as the bottom floor of the model.
Figure 2.19 shows the SAP2000 model of Floor 3 to Floor 7 with bracing.
After we modeled Floors3 to 7, we modeled the framing and bra-cing for Floors 22 to 24.Figure 2.20 shows Floor 22 to Floor 24 with concrete slab floors and released joints. The released joints are represented by the green dots on the model because the bracing could barely sustain any bending.(The bracing in the model of Floor 3 to Floor 7 was prepared with released joints, but released joints are not shown in the figure.)

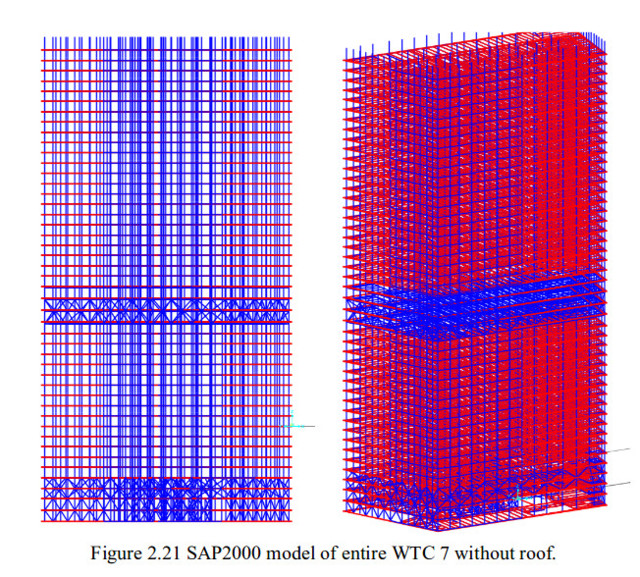
Next,we modeled the entirety of WTC7 with the exception of the rooftop.Figure 2.21 shows the entire WTC7 model with the concrete slab floors and the bracing, but without the roof.
After the entire WTC7 was modeled in SAP2000, boundary condi-tions for Floors 12 and 13 assembly were modeled. We modeled Floor 12 andFloor 13 using both ABAQUS and SAP2000. A signifi-cant effort wasmadeto model the buil-ding connections so that we could properly account for the boundary conditions and properly use “substructuring” to acceleratethe computer analysis time.
Figure 2.22 shows the modelfor Floor 12 to Floor 47. Figure 2.23 shows the modelfor Floor 3 to Floor 12.

The loading condition for the Floor 12and 13 assembly was calcula-ted by imposing axial forces acting on the top of Floor 13. The column number sequence is shown inFigure 2.24 (NIST, 2008, NCSTAR 1A). The axial force acting on each column is given in Table 2.1. The loading for Column 79 is highlighted in the table be-cause NIST concluded that the collapse of Column 79 at Floor 13 initiated the building’s progressive collapse (NIST, 2008, NCSTAR 1A).


The boundary condition for the Floor 12 and 13 assembly was obtained by analyzing the Floor 3 to 12 combination. The computer model included spring stiffnesses to simulate each connection type. The spring stiffness at the four far corners of Floor 12 was then checked by imposing unit for-ces in both horizontal directions xand yat each corner, then calculating the 45responses of the model under unit forces, and thensolvingthe matrices byassembling the responses of the model to obtain spring stiffnesses.
2.4. Slab Sub-models
After modelingthe boundary conditions for Floors 12 and 13, we modeled the concrete slab of Floors 12 and 13. A ty-pical concrete floor slab inWTC7 was not made of homoge-neous material. The floor slab consisted of different layers and was not of uniform width. A typical concrete floor slab is shown in Figure 2.25. The typical concrete slab consisted of gauge 20 steel deck with 5.5-inch-deep concrete on top.The reinforcement was 6/6-W1.4 W1.4 welded wire fabric (W.W.F.) at 2.5 inches from the top surface of the concrete. Modeling a typical floor slab was done using SAP2000. A small section of the model is shownin Figure 2.26.

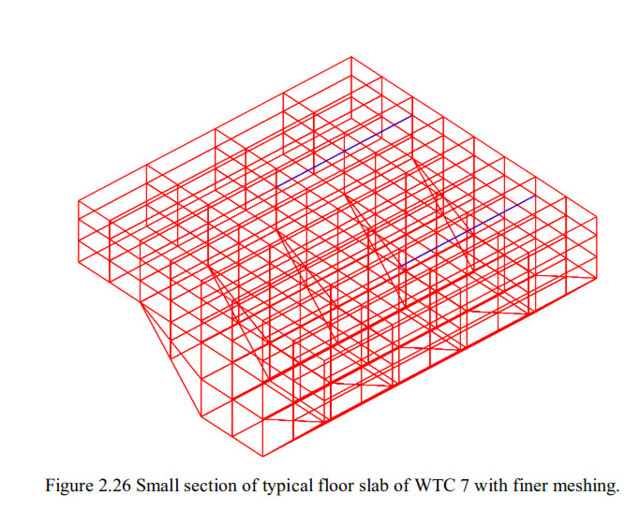
In order to achieve accurate and reasonable results, we studied mesh refinement to achieve convergence.
Figure 2.27and Figure 2.28 show different floor slabs with different meshing.The meshing schemes are presented for comparative pur- poses.After conducting a convergence study to evaluate the appro- priate meshsize, the model of the floor slabs was compared to the 5.5-inch-thick homoge-neous material in SAP2000. The concrete used for WTC7 was 3,500 psi in compressive strength and a 3,408,800 psi Young’s modulus, which was based on an assumed 145 pcf density. The steel used for the gauge 20 metal deck and welded wire fabric reinforcement was A36,with Young’s modulus of 29,000,000 psi and yield strength of 36,000 psi.
The purpose of the analysis was to find an equivalent homoge-neous material 5.5 inches thick that would behave in the same manner asa typical floor slab in WTC7for agiven length and width and under the same loading conditions. Such material was needed to save computational time and resources so that the floor slabs could be modeled by using simple homogeneous shell elements in-stead of layers of materials consisting of frame,shell, and solid ele-ments, with the exact and very complicated geometry representing the real floor slabs.

Figure 2.28 above shows how we modeled the floor slabs to determine a cal-culated equivalent homogeneous material in the flute direction. The left side is the 5.5-inch-thick homogeneous shell elements acting as the equivalent floor slabs.The right side is the model that 48 represents the floor slabs with the frame, shell, and solid elements. Both sides have the same width and length, and were subjected to the same loading conditions.To determine the equivalent homogeneous material to represent the floor slab, the deflection of the slabs made of the equivalent material should be the same as the composite floor slabs with frame, shell, and solid elements.
Figures 2.29 and 2.30 below show the modelingof the floor slabs for the cal-culation of the equivalent material in another direction. That is, the floor slabs of WTC7 had two directions. The direction in which the flutes ran had a high-er resistance to bending. The orthogonal direction had a lower resistance to bending. Therefore, the equivalent homogeneous material was not isotropic.
Figure 2.29 is a modelof the stronger direction.
Figure 2.30 is a model of the weaker direction.


The calculated equivalent homogeneous material had a different Young’s modulus in each of two orthogonal directions. The equivalent Young’s modu-lus along the flutes direction was 6,730,000psi and 3,285,000psi in the other direction.Note that the equivalent Young’s modulus in the flutes direction was significantly larger than the Young’s modulusofjust the original concrete of 3,408,800 psi, and the weaker direction was only a little less than the original one. This approach enabled our team to accommodate a change in stiffness in the different directions using shell elements.
2.5 ABAQUS Modeling
ABAQUS is capable of performing fire analysis, structural response to wind blasts caused by a building collapse, and simulation of a progressive structu-ral collapse. Using wire (beam) elements, Floors 12 and 13 were simulated using a finite element modelin ABAQUS (see Figure 2. 31below). Analytical results were compared with SAP2000 results for accuracy.
50
2.5.1 Floors 12 and 13 ABAQUS Model
The concrete decksof Floors 12 and 13 were approximated using shell elements. The frames were approximated using beam elements. Decks and frames (beams and girders) were modeled as composite behavior.

To evaluate the required number of links, we studied three simple beams (Figure 2.33), built by using 3, 9, and 17 links (Figure 2.34). The beam was approximated using beam elements.The slab (deck) was modeled with shell elements. The beam span was 52.75 feet; the specified uniformly distributed load was 0.657 kip/ft. The effective width of the slab (deck) was 114.25 inches, and the thickness was 5.5 inches. The steel section was W 24x55.
It was the objective of this study to assure that the interactive behavior bet-ween beam and slab were properly accounted for. Dead load was accounted based on the material density and the geo-mery of thesections. Live load was introduced as an external load.


52
Mid-point displacements of each beam deck analyzed using ABAQUS were compared with a hand calculation. The details for ABAQUS and hand calcu-lation results converged with an increase in the number of links between the deck and beam (Table 2.2).The results show that the error drops significantly atthe 9-link condition (Figure 2.35).

2.5.2 Structural Steel Connections Using ABAQUS
WTC7 is a steel-framed structure with numerous connections. To accurately evaluate the stiffness of the structure, we modeled the structural framing member, each connection type, and their attachment to the appropriate beams, girders, and columns. Each connection type was modeled using non-linear coil and nonlinear axial springs that provided for axial, shear and mo-ment transfer between members.In order to minimize computer analysis time while accurately determining structural response due to a given load, we used substructuring. The WTC7 connectors may be shear, moment, or semi-rigid connectors that transfer shear and moment. The response of this struc-ture to load is dependent on how loads transfer from the floor to beams, the beams then transfer these loads to the girders, and the girders transfer the loads to the columns. In order to properly simulate the response of this buil-ding to load (vertical and horizontal), we needed toaccount for the behavior of each type of connector. Therefore, we modeled each type of connector in ABAQUS.
Figure 2.36 shows connector type “STC” and its response to shear.

Atypical simple shear connector that was used to connect a beam to girders is shown in Figures 2.37 and 2.38.

To minimize computer analysis time, semi-rigid connections were modeled and analyzed separately. A detailed connection was built based on the con-struction drawing. Nonlinear curves, such as shear-displacement, etc., were calculated (Figure 2.39a). Nonlinear springs were used to simulate the semi-rigid connection nonlinear behavior, includingnonlinear behavior of connec-tions (Figure 2.39b). Ro-tational nonlinear springs were defined in the WTC7 globa l model (Figure 2.39c).

562.5.2.1 Types of connections modeled using ABAQUS
Seven types of connections were modeled using ABAQUS.2.40 is a fin connection sample between aninterior girder and abeam.
Figure 2.41 is the header connection between the girder and the beam.
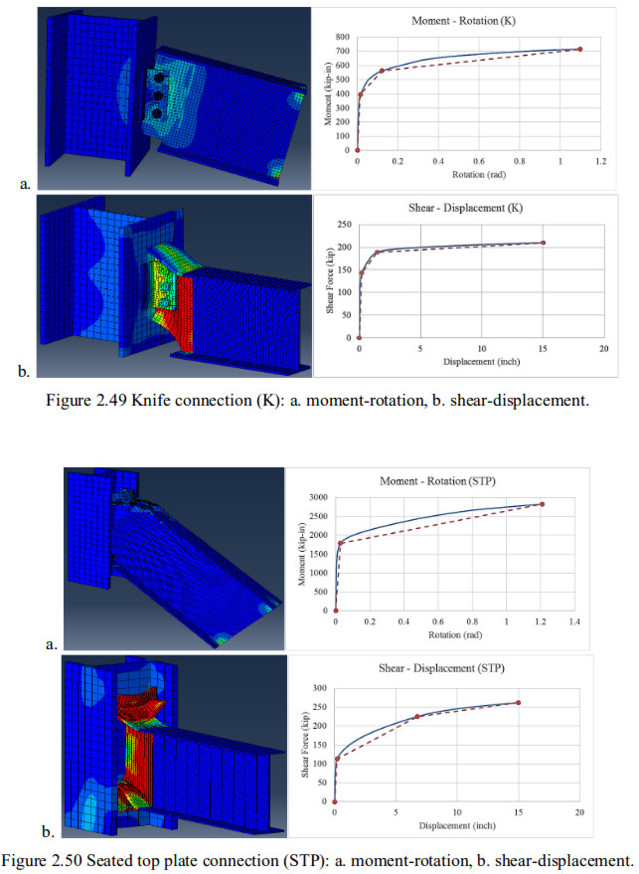
Figure 2.42 is a knife connection between girder and column.
Figure 2.43 is the seated top plate connection between interior girder and exterior column.
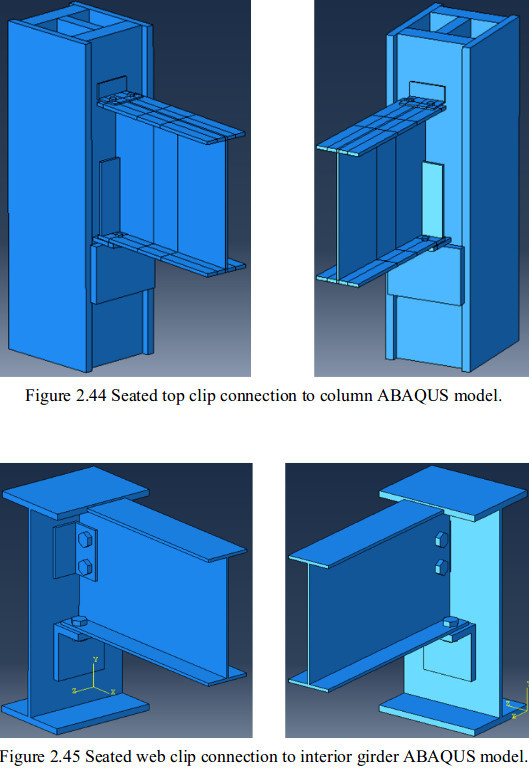
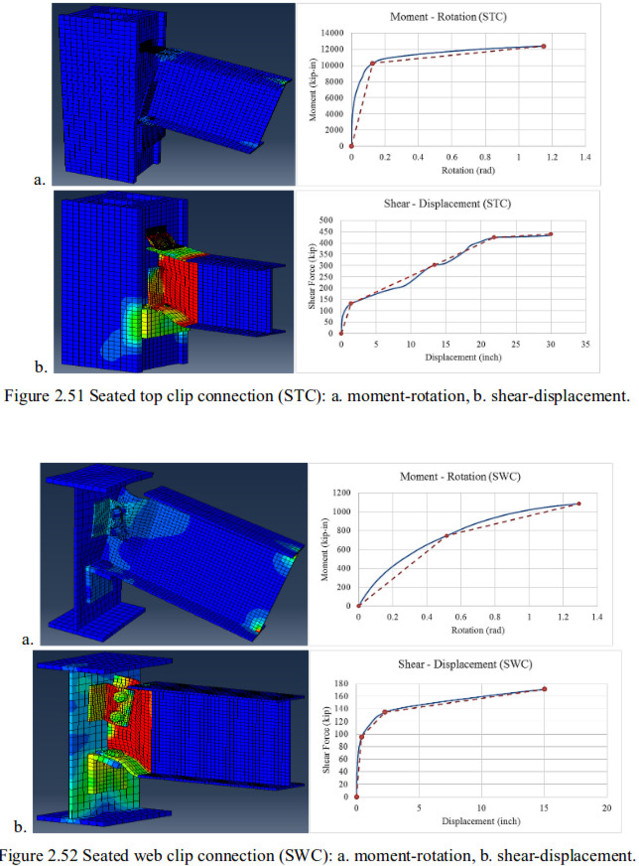
Figure 2.44 is the seated top clip connection sample located at the girder framed into the north side of Column 79 at stories12 and 13.
Figure 2.45 is the seated web clip connection between interior girder and beam.
Figure 2.46is the seated moment connection at outside frames.


RK: These connections are interesting. That is why I copied them.
FR: " 2.5.2.2 Connection Nonlinear Analysis Results
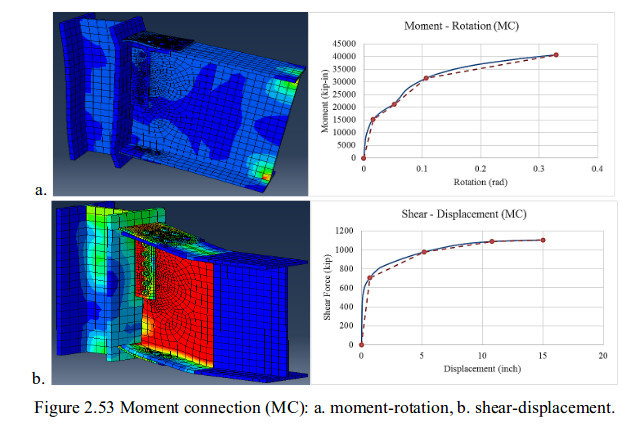
Figure 2.47 through Figure 2.53 show our connection nonlinear analysis results.
Figure 2.47a through Figure 2.53a show themoment-rotation response, and Figure 2.47b through Figure 2.53b show the shear-displacement response.
In each figure,the blue line is the actual behavior of the connection and the red dotted line is an approximation of the actual (nonli-near) behavior to enable us to mathematically approximate the behavior under load with a high degree ofcomputational efficiency.


2.6 WTC7 Structural Response to Fire Loading
The WTC7 fire loading analysiswasbased on NIST’sfire modeling for Floors 12 and 13 (Figure 2.54), which we reviewed and determined to be a reason-able worst-case scenario. Boundary conditionsare presented in Section 2.1.2. To examine the movement of the floor system surrounding Column 79 in response to thermal loading, we considered the worst-case temperatures in the computed temperature distribution reported by NIST.
RK: No worh while criiizing. That was not the way how thermal expansions effected in the collapse.
... 75
FR: " ... CHAPTER 3.0
EVALUATION OF NIST’S COLLAPSE INITIATION HYPOTHESIS
This chapter presents the findings of our evaluation of NIST’s collapse initi-ation hypothesis. Given that our findings diverge widely from those of NIST, our goal was to understand how NIST arrived at the conclusion it did and to identify any errors in NIST’s analysis that led to such a conclusion.
In addition, we briefly evaluate the collapse initiation hypotheses advanced by Arup/Nordenson (Arup and Nordenson, 2010) and Weidlinger (Weidlinger, 2010).
3.1 Methodology and Modeling Assumptions
A solid model (as opposed to wire elements) of the structural members in the northeast corner of Floor 13 was generated using ABAQUS (see Figures 3.1 and 3.2).The model consisted of 49,270 nodes and 24,536 elements. A finite element analysis was performed with the aim of replicating the results repor-ted by NIST. Namely, the result of NIST’s analysis is that girder A2001 was pushed or rocked off its seats at Columns 44 and 79, and this initiated the total collapse of the building. "
RK: This is a wrong interpretation: girder line 26-44 got a tranlation degree of free-dom of motion in its direccion due to the loss of lateral support from exterior wall 24 - 42. That was the reason of the collapse.
FR: "We performed our analysis using many of NIST’s modeling assumptions in order to determine whether NIST’s results were replicable using even the most generous assumptions. However,it is important to understand that most of these assumptions — which were used for the purposes of this analysis — are either invalid or at best questionable. These assumptions and our expla-nations for why they are invalid (with the exception of the last two) are listed below.
3.1.1 NIST’s Modeling Assumptions Used by UAF Team
1. NIST assumed the east exterior wall to be rigid and not deflect due to the expansion of beams K3004, C3004, B3004, A3004, and G3005, which would cause all thermal expansion of the heated ho-rizontal members to move westward in the direction of Column 79. "
RK: The shifts of the critical column from THERMAL EXPANSIONS were not essential...
FR: " We found that the exterior of the building was transversely very flexible.
Further, we found that the point of zero thermal movement in the plane of the floor was near the elevators,and this alone dramatically affects the expansive movements of the floor framing as temperature rises. In short, there is no basis for assuming the exterior wall to be rigid.
2. NIST assumed that shear studs on beams K3004, C3004, B3004, A3004, and G3005 were broken due to differential thermal movement. We analyzed these phenomena in our previous analyses and found that this would not have occurred. "
RK: NIST hardly has based this only on calculations.
FR: " 3. NIST assumed that no shear studs were installed on girder A2001. It was subsequently shown in the Arupand Nordenson reports that girder A2001 did have shear studs. "
RK: Not essential...
4. NIST assumed that th ebolts fastening girder A2001 to its seats at columns 44 and 79 were broken. We analyzed these phenomena in our previous analyses and found that this would not have occurred. "
RK: Not essential...
FR: " 5.NIST assumed that the thermal expansion of beams to the east of gir-der A2001 was sufficient to move the girder’s web a sig-nificant distance be-yond its seat. We needed to increase the coef-ficient of thermal expansion of the steel used for beams K3004, C3004, B3004,and A3004 by approximately 40% to 11.5 x 10⁻⁶ in/in/°F in order to generate sufficient thermal expansion.,
6. NIST assumed that the beams were heated to 600°C,that girders A2001 and A2015 were heated to 500°C, and that the columns were heated to 300°C. This was examined in our study and we found no problem with this assumption.
7. NIST assumed that the floor loading was 88 lbs./ft2.We confirmed this loading.


3.2 Evaluation and Discussion of NIST’s Collapse Initiation Hypothesis
Figure 3.3 shows the built-up configuration of Column 79 with its protruding side plates. Using the assumptions made by NIST, we analyzed the thermal response of Floor 13.
3.2.1 Girder A2001 Trapped by Side Plate First, we found that when girder A2001 is heated, it expands axially towards column 79, such that it becomes trapped behind the side plate on the western side of Column 79 as it is pushed to the west by ther-mally expanded beams K3004, C3004, B3004, A3004, and G3005 (see Figures 3.1 and 3.4).


77
Figure 3.5 shows the girder bearing seat at Column 79 is 12 inches wide.
The flange width for W33 x 130 girder A2001 is 11.510 inches wide and centered on the seat; its web is 0.580 inches thick. This would require a lateral travel distance of 6.290 inches for the web to be beyond the seat. However, the distance between the column side plates is 17.89 inches.The girder and bearing seat are slightly off center to the east, with just 3.678 inches between the girder's western edge and Column 79's western side plate. Thus, the side plate prevents the girder’s web from traveling beyond the bearing seat. Given that the Column 79 side plate prevents the girder’s web from traveling beyond the bearing seat, it appears that the structural analysis performed by NIST either minimized the side plate protrusion on Column 79 (nominally 1.79 inches) or ignored it altogether.
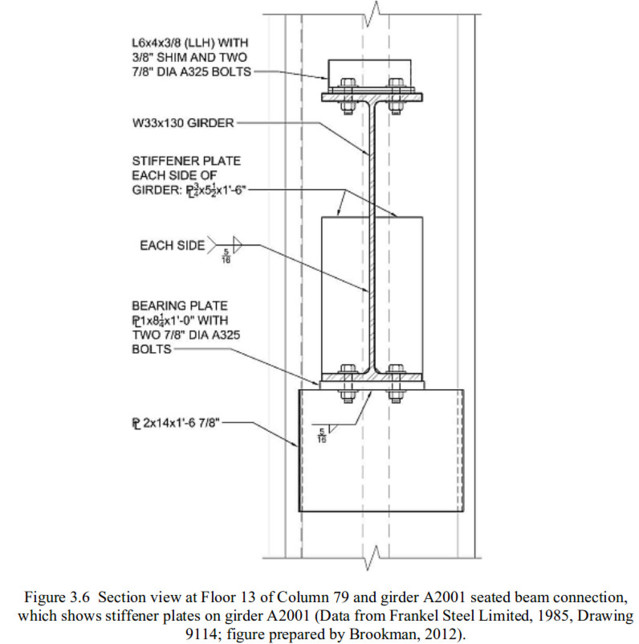
3.2.2 Girder A2001 Web Stiffeners Prevent Flange Failure and Girder Walk-off
A separate model was generated to determine what would happen if girder A2001 were able to somehow move past the Column 79 western side plate. This model removed the side plate protrusion that we found in our previous analysis would inter-fere with the girder’s lateral travel. The results are shown in Figures 3.7 and 3.8. To perform this analysis, the coefficient of thermal expansion of the steel used for beams K3004, C3004, B3004 and A3004 was increased by approximately 40% to 11.5x10⁻⁶ in/in/°F to ensure the girder’s web moved a significant distance beyond the seat. This modification to the modeling parameters underscores the fact that under a realistic assumption of the coefficient of thermal expansion, beams K3004, C3004, B3004, and A3004 would not expand far enough to push the girder’s web beyond its seat.
Figure 3.7 Plan view shows girder A2001 being pushed laterally past notched western side plate.
It is important to note that the analysis performed by NIST did not include the ¾ inch thick x 5.5 inch wide x 18 inch high partial height web stiffeners on girder A2001. Re-leased fabrication shop drawing Frankel 9114 shows that the stiffeners were part of that structural member (Frankel Steel Limited,1985). In addition to stiffening the web, these stiffeners significantly increase the bending resistance of the flange and would have prevented it from failing due to flexure (assuming the girder were somehow able to bypass the column side plate). Note that the small amount of high stress on the corner of the girder’s flange is not in a load bearing area.This stress is due to the girder flange being slightly compressed in the axial direction by its contact with the column flange when the girder is thermally expanded. Figure 3.8 shows that the stresses in the girder flange and stiffener are not sufficient to cause the flange to fail. The expanded girder could not possibly be shortened enough to come off the seat axially or to cause the seat to fail in bending. The edge of the support plate, which supports the bearing seat,is 3.8" from the face of the column flange.The two erection bolts between the girder and the bearing plate were claimed by NIST to have broken due to thermal expansion and are not shown for clarity.

Figure 3.8 Analysis showing girder web A2001 pushed laterally past the bearing seat at Column 79. The column is removed for clarity.
Figures 3.9 and 3.10 below, which are from the NIST report, show that the NIST report’s drawing and analysis figures omit these web stiffeners. Figures 3. 5 and 3.6 show the actual configuration.

Figure 3.9 Drawing of Column 79 and girder A2001 seated beam connection shown in Figure 821 of the NIST report.
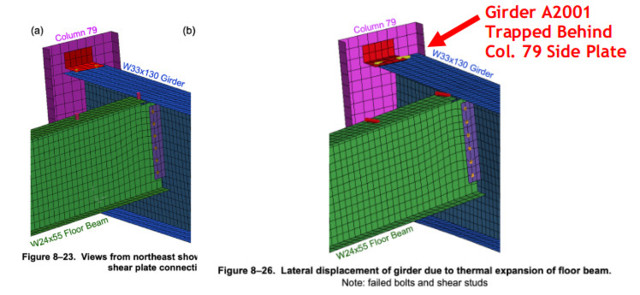
Figure 3.10 Figure 8-23 of the NIST report showing NIST’s finite element analysis of the Column 79 and girder A2001 seated beam connection.
3.2.3 Lateral Support Beams Prevent Beam Buckling Figures 3.11, 3.12, 3.13, and 3.14 show our evaluation of NIST’s preliminary hypothesis, which NIST used to de-termine whether the shear studs on the floor beams would fail when the floor system was heated. The NIST report posits that beam G3005 buckled because its thermal expansion was restrained by girder A2001. Our analysis found that this can only happen when the three lateral support beams S3007, G3007, and K3007 spanning from beam G3005 to the north exterior wall are not included in the model. While these short beams are observed in some of the figures in the NIST report, they are missing from the model(s) used in the thermal and structural analyses shown in the report. It is important to realize that the lateral support beams have a significant effect and therefore should not have been omitted from the model(s). In addition, the NIST report describes the response of beam G3005 based on the wrong size beam. Erection drawing E12/13 (Frankel Steel Limited, 1985) shows a W21x44 for G3005 and a W24x55 for the four adjacent beams (K3004, C3004, B3004, and A3004). The erection drawing shows G3005 framing into the wind girder.However,the NIST report shows analysis results for G3005 based on a W24x55, not a W21x44. Further, the NIST report results were based on a modeling error in that this beam framed into an exterior girder, not an exterior column (see Figures 3.11 and 3.14).
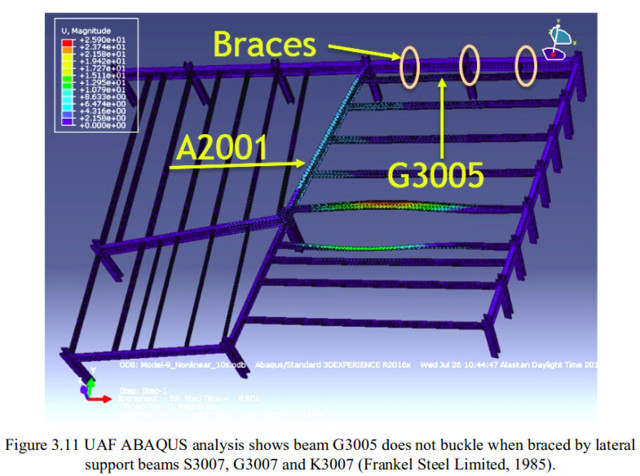


When the NIST constraints are followed,our analysis showed that beams D3004 and K3004 would have also buckled (see Figures 3.11 to 3.14). The NIST results were based upon erroneously selected boundary conditions, wherein NIST assumed the east exterior wall was extremely stiff and acted as a fixed restraint against thermal movements. As discussed previously,this was not the case.Figure 3.14 above shows that girder A2001 was restrained by the Column 79 side plate. As a result of girder A2001 being restrained, beams D3004 and K3004 are buckling. In addition, girder A2002 is being pushed to the east along with Column 79 by girder A2015 from the west. The beams adjacent to beams D3004 and K3004 do not buckle and therefore no full floor collapse would be expected.
87
It should also be noted that the lateral travel of Column 79 to the east due to the thermal expansion of girder A2015 would be reduced if the concrete floor slabs had been included in the model.
3.3 Evaluation of the Arup and Nordenson Collapse Initiation Hypothesis
Experts working in connection with engineering firms Ove Arup&Partners (Arup) and Guy Nordenson and Associates (Nordenson) were retained by the plaintiffs in “Aegis Insurance Services, Inc. v.7 World Trade Center Company, L.P.” to perform structural analysis in support of the claim that the collapse of WTC7 resulted from deficient de-sign, thus making the defendants liable for the destruction of the electrical substation over which WTC 7 was built. The Arup and Nordenson reports were filed with the court in April 2010. The Arup report concluded that the girder (A2001) that NIST re-ported was pushed off its seat by thermally expanding beams to the east of the gir-der was actually pulled off its seat by the sagging of beams to the east of the girder. This girder walk-off, according to the Nordenson report, then caused the same cas-cade of floor failures and buckling of Column 79 reported by NIST.However, contrary to NIST’s findings, Nordenson found that the alleged failure of other girder connec-tions framing into Column 79 on lower floors, which was necessary along with the afore-mentioned cascade of floor failures in order for Column 79 to buckle, could not have been caused by thermal expansion. The Nordenson report instead put forth the idea that these girder connections failed due to stress raisers (cracking) caused by repeated heating and cooling cycles. However, this structure did not experience heating and cooling cycles anywhere near sufficient to allow stress raisers to cause fatigue failure.
3.3.1 Discussion of Arup and Nordenson’s Analysis
The Arup analysis was performed in a serial way with a fire simulation, heat transfer analysis, finite element analysis of the northeast corner of Floor 13, and a global col-lapse analysis (which was performed primarily using traditional hand calculations). The Arup finite element analysis corroborates our finding that girder A2001 would become trapped behind the western side plate of Column 79 after less than 4 inches of lateral travel when pushed to the west, and that its web could not have been pushed beyond its bearing seat in that direction. However, the Arup analysis then goes on to contend that the five beams to the east of girder A2001 (K3004, C3004, B3004,A3004,and G3005) were heated enough to sag and pull the girder to the east and off of its seats, creating the same situation as claimed by NIST where the girder and the flooring it supported fell onto Floor 12 below. The global collapse analysis (the Nordenson section of the report) then attempts to show how the load from the impact between the falling Floor 13 girder and Floor 12 girder below was sufficient to cause the lower floor to fail, which then precipitated a multi-story cascade similar to that claimed in the NIST report.
In Appendix B of his section of the report (Floor Collapse Analysis), Nordenson cor-rectly shows that it would take a 632,000 lb. load to shear the welds of the 2” thick x 14” high x 18” wide support plate under the bearing seat of girder A2001 at Column 79. Nordenson also correctly determines the stiffness of girder A2001 on the 12th floor at a point 10 inches from its support at Column 79 to be K=7,627 kips/inch using the equation K = (3*E* I* L)/ (1 kip * a2 b2) with “a” and “b” being the distances to the impact point from opposite sides of the girder,which was considered to be 547 inches long.
However, there was an error in Nordenson’s calculation of the impact force of 4,133 kips, which resulted from considering the above girder as a point load, thus implying it had an infinite stiffness and no deflection. The magnitude of the force experienced in an impact is directly proportional to the stiffness and deflection of the impacting items. By default,the use of a point load for the upper girder makes the high stiffness of the girder below at 10 inches away from its support the only stiffness used in the calculation, resulting in a correspondingly high, but inaccurate, force.
In reality, the girder falling from above would also have a stiffness, with the relevant stiffness for the calculation of the impact load being that of two springs in series using the equation 1/Kt = 1/K1 + 1/K2.
To determine the stiffness of the falling Floor 13 beam and girder assembly, a finite element modal analysis was performed with the assembly constrained at the north and east exterior walls and the girder sitting on its bearing seat at Column 44 with the bolts at the girder seat broken there. The results are shown in Figure 3.15. The first mode of 22 Hz involved only the beams moving in a transverse direction and was not relevant.The second mode of 0.52 Hz involved the participation of the entire beam and girder assembly in the vertical direction and was relevant.

The stiffness that is used in the impact calculations is the combined stiffness of both the falling beam and girder assembly (K1) and that of the girder on Floor 12 below at 10 inches from its support at Column 79 (K2). It is

Thus,

Using Nordenson's potential energy (P.E.) of 3,473,000 in-lbs. and the calculated stiffness, in the same standard equation he uses to find deflection (D)
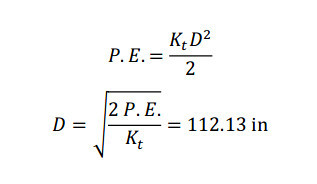
and finally using the standard equation Nordenson uses to find force (F)

This 61950 lb. impact force is less than 10% of the 632000 lb.force required to shear the girder bearing seat support welds and is thus quite insufficient to do so.This ana- lysis was performed at room temperature; higher temperatures would soften the gir-ders, causing even lower impact forces. Therefore, the northeast corner of Floor 12 would not have collapsed if a girder from Floor 13 came off its seat at Column 79 and fell onto it. As a result, the Nordenson portion of the Arup analysis does not demonstrate that propagation could occur after the supposed initiating failure, even if the girder were to fall off its seat at Column 79. This is a fatal flaw in the Arup and Nordenson analysis.
3.4 Evaluation of the Weidlinger Collapse Initiation Hypothesis
The engineering firm Weidlinger Associates Inc. (Weidlinger) was retained by the defendants in “Aegis Insurance Services,Inc. v.7 World Trade Center Company, L.P.” to perform structural analysis in support of their defense that the collapse of WTC 7 did not result from deficient design and was instead caused by the extraordinary events of September 11, 2001. The Weidlinger report was completed in October 2010 but was never filed with the court. It was then made public in June 2016.
3.4.1 Discussion of Weidlinger’s Collapse Initiation Hypothesis
As would be expected, the Weidlinger report attempts to rebut the Arup and Norden-son reports. Among its points of rebuttal, it corroborates our finding that the falling Floor 13 beam and girder assembly could not break through the next floor down. The collapse initiation hypothesis presented in the Weidlinger report, which is based on fire modeling performed by Dr. Craig Beyler of Hughes Associates, is that Floors 9 and 10 were simultaneously heated to between 750° and 800°C in the exact same area of each floor. This extreme heating eventually caused Floor 10 to give way and break through Floor 9, which was possible only because of the extreme heating of Floor 9. The falling debris from these initial floor failures was sufficient to cause a cascade of floor failures through the unheated floors down to Floor 5, diminishing the lateral support for Column 79 and two nearby columns, Column 80 and Column 81, thus causing the columns to buckle and trigger a progressive collapse of the entire building. However, the details of the thermal analysis by Dr. Beyler are not shown in the Weidlinger report, and Beyler’s analysis has not been made public, despite its central importance to Weidlinger’s hypothesis. It is important to understand that steel structural members reaching temperatures of 750°C due to office fires can be consi-dered extraordinary. Without any analysis provided to substantiate such tempera-tures, Weidlinger’s collapse initiation hypothesis must be viewed skeptically and can only be assumed to have a very low probability of occurrence.
CHAPTER 4.0 SIMULATING THE COLLAPSE OF WTC 7
This chapter presents the findings of our collapse analysis for the collapse of WTC 7. The goal of our analysis was to determine what types of local failures and their locations may have caused the total collapse to occur as observed.
4.1 Key Features of the Collapse
Based on our review of video footage and of the NIST and FEMA Reports, we identi-fied three key features that occurred during the collapse of WTC 7, which we then attempted to replicate in our simulations of the collapse. These three key features are as follows:
1. The collapse of the east penthouse, which begins approximately 6.9 seconds prior to the descent of the north face roofline;
2. The collapse of the screen wall and west penthouse, which begins approximately 0.5 to 1 second prior to the descent of the north face roofline; and
3. The descent of the north face roofline, which progresses at a rate of free fall for approximately 2.25 to 2.5 seconds over a distance of approximately 105 feet or 8 stories, during which the building’s sheathing remains attached to the exterior steel framing and does not experience visible differential movements.
4.1.1 Discussion of NIST’s Progressive Collapse Simulation
During our nonlinear connection study (Section 2.1.3.2), wherein we examined NIST’s modeling of WTC 7’s structural connections and its effect on NIST’s progres-sive collapse simulation, we also observed that NIST’s progressive collapse simu- lation did not closely resemble the observed collapse. While NIST’s progressive col-lapse simulation does show the three key features listed above, it also predicts signi- ficant differential movements in the exterior, both before and during the fall of the roof-line, that were not observed in the video (see Figures 4.1a and 4.1b).Such diffe-rential movements in the exterior would be extremely likely to have caused window breakage, cracking of the façade, and exterior deformation, none of which were observed. A major goal of our analysis was to identify failure mechanisms that would predict the minimal differential movement of the exterior seen in videos of the collapse.
However, it should be noted that after the east penthouse collapse, window brea-kage did occur for 12 to 15 floors down from the top of the building under the pent-house. This was most likely caused by shock waves propagating down inside the building due to the collision of the penthouse materials and equipment with the floors below.


4.2 The UAF Research Team’s Approach
We used both ABAQUS and SAP2000 finite element software to simulate various types of failures. Subsequently, several hypothetical scenarios were examined in order to determine what types of local failures could and could not produce the key features described above.One set of analyses was performed for the collapse of the east penthouse.A second set of analyses was performed for the collapse of the west penthouse and north face roofline (i.e., the main observed collapse event). The co-lumn beam framing connections for the penthouse were considered rigid as it shor-tened modeling time while minimally affecting the response and resulting behavior of the structure. However, it did affect the appearance at the bottom corners of the penthouse.
For all collapse models and analyses, we included the debris damage assumed by NIST, which involved six exterior columns on the southwest face of the building reportedly being severed by falling debris from the collapse of WTC 1.
In all cases, failure simulations were based on finite element analysis results and the deformations presented were scaled by the software to help the reader visualize direction and relative magnitude for the displaced shape(s). Displaced magnitudes in each figure are exaggerated and are not scaled to the building geometry. Displacement values are typically given in inches within each figure.
4.2.1 Hypothetical Failure Mechanisms for the East Penthouse Collapse
The east penthouse was supported by Columns 79, 80, and 81.
Therefore, like NIST, we hypothesized that the collapse of the east penthouse resulted from these three columns failing.
The main question we sought to address in our simulations - and where our findings diverge from NIST’s - was the height at which Columns 79, 80, and 81 most likely failed.
NIST hypothesized that these columns failed due to Column 79 losing lateral support from Floor 5 to 14, i.e., the columns failed relatively low in the building (the local failures alleged by NIST to have caused the loss of lateral support for Column 79 are examined in the preceding chapters).
We simulated the failure of Columns 79,80,and 81 at different floor intervals through- out the building - starting from Floors 6 to 13 and continuing all the way to the upper- most part (Floor 45 to the penthouse) — and examined the resulting behavior of the east penthouse as well as the behavior of the building’s exterior.
4.2.2 Hypothetical Failure Mechanisms for West Penthouse and North Face Roofline Collapse
In the progressive collapse scenario advanced by NIST, the failure of Columns 79, 80, and 81 that directly caused the collapse of the east penthouse also initiated a horizontal progression of core column failures that took out every core column.
According to NIST, this redistributed loads to the shell of exterior columns, which gave way shortly after the core columns failed (in NIST’s scenario, the collapse of the exterior shell is what was observed and captured on video).
First, we simulated NIST’s scenario. Finding that NIST’s scenario was not feasible, we simulated another scenario: the simultaneous failure of all core columns over the 8 stories between floors 12 and 19 followed 1.3 seconds later by the simultaneous failure of all exterior columns over the same 8 stories. Further, we attempted to verify a kink in the north face. This kink shows up in the video as the structure begins to collapse. It is argued that the kink was a result of inner core columns failing first and the remaining exterior columns pulled in (i.e. buckling inward) shortly after. However, we were unable to simulate this phenomenon with the software.The limitations of the software in modeling buckling with time is based on needing small time steps and small incremental deformations within each time step.
4.3 Results of the East Penthouse Collapse Analyses
The linear static analysis results for the simulations where we removed Columns 79, 80, and 81 at different floor intervals are shown in Figures 4.2 to 4.7 below.
Based on these analyses, we found that Columns 79, 80, and 81 did not fail at the lower floors of the building (e.g., from Floor 6 to 13 or Floor 13 to 21). We found that the failure of Columns 79, 80, and 81 at the lower floors of the building would cause the building to tilt dramatically to the east, which would have been observed in the videos but was not, and that it would not cause the east penthouse to collapse, be-cause the intact portions of Columns 79, 80, and 81 above where the columns failed would still support the penthouse.
On the other hand, we found that the failure of Columns 79, 80, and 81 at the upper floors of the building, especially at Floor 45 all the way up to the penthouse, would cause the penthouse to collapse into the building as observed,while causing minimal movement of the exterior. It appears, therefore, that Columns 79, 80, and 81 failed at the upper floors of the building.
In addition,our analysis shows that the east penthouse collapsed only as far down as the upper 3 to 5 stories of the building. Thus, Columns 79, 80, and 81 essentially re-mained intact except at their upper stories and did not collapse until the entire inner core did. Columns 79, 80, and 81 remaining intact for most of their height until global collapse would help explain the lack of observed exterior column deformation on the east side of the building, compared to the significant deformation of the exterior pre-dicted in NIST’s global collapse analysis. Since the collapse of Columns 79, 80, and 81 high in the building appears to have had little effect on the structure other than causing the collapse of the east penthouse, we conclude that these failures were a separate and distinct event from the global collapse.
These findings directly contradict the scenario described by NIST. Furthermore, the probability that the failure of Columns 79, 80, and 81 at the upper floors was caused by fires is virtually zero, since there were no documented fires above Floor 30, and the fires on Floors 19, 22, 29, and 30 were of relatively short duration.
Figure 4.2 Columns 79, 80, and 81 are removed from Floor 6 to Floor 13. The key to the right is expressed in inches of movement. The building tilts to the east almost 10 inches. The penthouse does not collapse.
Figure 4.3 Columns 79, 80, and 81 are removed from Floor 13 to Floor 21. The building tilts to the east 7.2 inches. The penthouse does not collapse.
Figure 4.4 Columns 79, 80, and 81 are removed from Floor 21 to Floor 29. The buil-ding tilts to the east 5.4 inches. The penthouse does not collapse, though penthouse deflection increases.
Figure 4.5 Columns 79, 80, and 81 are removed from Floor 29 to Floor 37. The building tilts to the east 3.85 inches. The penthouse does not collapse, thought its deflection increases.
Figure 4.6 Columns 79, 80, and 81 are removed from Floor 37 to Floor 45. Tilting of the building is now negligible, whereas the deflection of the penthouse is now much greater.
Figure 4.7 Columns 79, 80, and 81 are removed from Floor 45 to the penthouse. Til-ting of the building is now negligible.The penthouse now collapses, as demonstrated from the significant amount of deflection given in the figure.
4.4 Linear and Dynamic Analytical Methods
Linear static analysis and dynamic time history analysis results from these simula-tions are shown in Figures 4.8 to 4.16 below. A time history analysis accounts for mass, velocity, and acceleration as a function of time. Direct integration is used by SAP2000 when performing a time history analysis.We examined structural response for a time history analysis using linear elastic behavior. We also studied the behavior considering material and geometric non-linearity effects. P-delta was not included in these results.
4.5 Results from Analysis of NIST’s Horizontal Core Column Failure Scenario
The linear static analysis results and dynamic analysis results from our simulation of NIST’s scenario of a horizontal progression of core column failures are shown in the figures below.
Based on these analyses, we found that the failure of Columns 79, 80, and 81 would not trigger a horizontal progression of core column failures. Our results show that when Columns 79,80,and 81 are removed, no other columns would buckle, including neighboring Columns 76, 77, and 78. This result is expected based on the design principle of redundancy.
Going one step further, we simulated the failure of Columns 76, 77, and 78, even though these columns would not buckle due to the loss of Columns 79, 80, and 81. With the removal of six core columns on the eastern side of the building (Columns 76 through 81),we found that a total collapse of the building would ensue. First, the axial loads on the exterior columns around the southeastern corner of the building would exceed design loads, causing these exterior columns to fail. The failure of these exterior columns would then cause the axial loads on most of the remaining core columns and some of the remaining exterior columns to exceed design loads, resulting in those columns failing and leading shortly thereafter to total collapse. However, rather than a straight-down collapse as observed, the building would tip to the southeast, as illustrated in Figures 4.14, 4.15, and 4.16 below.
We draw two main conclusions from our attempt to simulate NIST’s scenario of a horizontal progression of core column failures:
1.A horizontal progression of core column failures - starting with Columns 79,80, and 81 - was not feasible. Therefore,the hypotheses of NIST,Arup/Nordenson, and Weid- linger that the buckling of Column 79 could trigger a progressive collapse of the en-tire building are invalid. 2. Even if we assume the failure of Columns 79, 80, and 81 could lead to the failure of the next row of core columns - Columns 76,77, and 78 - the loss of these columns along with the loss of Columns 79, 80, and 81 would over- load the exterior columns around the southeast corner of the building rather than overloading the next row of core columns to the west, which would result in the building tipping to the southeast and not in a straight-down collapse.
We can also derive from this analysis that even if the full horizontal progression of core column failures asserted by NIST, Arup/Nordenson, and Weidlinger had some-how occurred, leaving the exterior standing as a hollow shell momentarily, it would still not result in the observed straight-down collapse.
Figure 4.8 Linear static analysis of Columns 79 to 81 (circled in green) being removed.
Figure 4.9 Linear static analysis of Columns 76 to 78 (circled in green) also being removed.
Figure 4.11 Linear static analysis results show that the failure of 10 exterior columns around the southeast corner leads to numerous core and exterior columns (circled in red) being overloaded and failing. A progressive collapse triggered by the hypothetical failure of Columns 76 to 81 is underway.
Figure 4.12 Linear static analysis results show that the failure of additional columns (shown in Figure 4.11 above) leads to the failure of the remaining core columns and many exterior columns (circled in red). The columns with blue values are in tension rather than compression, indicating the building is tipping away from those columns.
Figure 4.13 Linear static analysis results show that the failure of additional columns (shown in Figure 4.12 above) leads to the failure of nearly every remaining column (circled in red).
Figure 4.14 A visualization of linear static analysis, from the southeast, showing movement to the southeast when Columns 76 to 81 are removed. The movement shown is highly amplified for clarity. The actual scale of the displacements are presented to the right.
Figure 4.15 Visualization of linear static analysis, from the southwest, showing the building tipping to the southeast after the hypothetical failure of Columns 76 to 81. The movement shown is highly amplified for clarity. The actual scale of the displacements are presented to the right.
Figure 4.16 Dynamic analysis results showing the building tipping to the southeast after the hypothetical failure of Columns 76 to 81. The movement shown is highly amplified for clarity.
4.6 Results of Core Column/Exterior Column Failure Analysis
Finding that NIST’s scenario of horizontal progressive core column collapse was not feasible,and would not result in the observed straight-down collapse,we then simula- ted the simultaneous failure of all core columns over 8 stories followed 1.3 seconds later by the simultaneous failure of all exterior columns over 8 stories. Dynamic time history finite element analysis results for this simulation are shown in Figure 4.17, in which the simulation is presented side-by-side with two videos of the actual building collapse. The simulated collapse was examined in two different perspectives to match the perspectives of two different videos.
Figure 4.17 (a) Comparison of simulated collapse to perspective 1; (b) comparison of simulated collapse to perspective 2.
Based on this analysis,we found that the simultaneous failure of all core columns followed by the simultaneous failure of all exterior columns produces almost exactly the behavior observed in videos of the collapse. The computer time history model accounted for mass and acceleration during collapse in which an acceleration time dependent function accounted for impact resistance over time. Specifically, the simulated velocity and acceleration of the building in our SAP2000 model, shown in Figure 4. 18, matches almost exactly with the motion measured by David Chandler (Chandler, 2010), including the approximately 2.5 seconds of free fall, shown in Figures 4.19 and 4.20 below.
Figure 4.18 UAF Simulation of core column-exterior column failure scenario.
Figure 4.19 Velocity analysis by David Chandler (Chandler, 2010)
Figure 4.20 Velocity comparison between Chandler measurement (green plotted line) and UAF simulation (red plotted line). Bold green trend line illustrates free fall.

It should be noted that we conducted two separate simulations involving the failure of the core columns and exterior columns over 8 stories: One was the failure of all columns from Floor 12 to Floor 19; the second was the failure of all columns from Floor 6 to Floor 13. The two simulations were identical in terms of the downward velocity and acceleration of the northwest corner at the top of building.We therefore found that the collapse could have started at various floors. Based on our subse-quent review of video footage, we found that Floor 16 is the uppermost floor where the collapse could have initiated, because the video shows Floor 17 to Floor 47 fal-ling uniformly as a unit (see Figure 4.21 below).Although some floors below Floor 17 are somewhat visible in the video, it cannot be determined with confidence that they are falling as a unit with the floors above.

Figure 4.21 Floors 17 to 47 falling uniformly as a unit (CBS).

4.7 Summary and Conclusion
1. Columns 79, 80, and 81 did not fail at the lower floors of the building. "
RK: This is a lie. There is no way to prove, that the floor elements "could not have fallen", like NIST says. That was a crucial part of the buildings planned mechanism to fall on footprints, if it collapses.
FR: " Instead, they needed to have failed at the upper floors of the building all the way to the penthouse. Yet there were no documented fires above Floor 30.
Therefore, fire did not cause the collapse of Columns 79, 80, and 81 nor the collapse of the east penthouse. "
RK: The fire did not cause their buckling collapse immediately by softening their steel, but mediatedly by falling the floor elements between their girder line 26-44 and stiffening the building outer wall 28-42 and in that way breaking tha lateral support of these columns in their girder line´s direction.
FR: " 2. The hypothetical failure of Columns 79, 80, and 81 — the three easternmost core columns — would not trigger a horizontal progression of core column failures. "
RK:The Collapse mechanism was not any horizontal progressing overloading failure, but a bundle buckling of columns caused by loss of stiffening mechanism of the building.
NIST has not said anything else its Final report on WTC-7 and in its simulation there.
FR: " Therefore, the hypotheses of NIST, Arup/Nordenson, and Weidlinger that the buckling of Column 79 would trigger a progres-sive collapse of the entire building are invalid, and the collapse of Columns 79, 80, and 81 high in the building was a separate and distinct event. "
RK: NIST has not said in its Final report that it had been any "trigger".
The trigger of the collapse mechanism was the fire and and damages from debris from the towers.
The progessive failure part of the collapse system were the falling floor elements dropping one another between girder lines girder lines 26-44 and 28-42.
The role of the buckling of the planned critical colmn 79 was, that it dropped down all remaining (in upper etages) floor elements between these lines (the fall of the wall).
(It would have been also possble to explode the building at the critical column in the cellar during the fire fighing with one effective charge; it would not have needed pre-charging, and it would have looked out the same, because it wold have porsessed same way after the critical column collapse.)
FR: " 3. Even if we assume the failure of Columns 79, 80, and 81 could lead to the failure of the next row of core columns, the hypo-thetical failure of Columns 76 to 81 would over-load the exterior co-lumns around the southeast corner of the building, rather than over-loading the next row of core columns to the west,which would result in the building tipping to the southeast and notina straight-down collapse. "
RK: Pläp pläp pläp...
FR: " 4. The simultaneous failure of all core columns over 8 stories followed 1.3 seconds later by the simultaneous failure of all exterior columns over 8 stories produces almost exactly the behavior observed in videos of the collapse. "
RK: Yes: the bundle buckling of all columns.
FR: " The collapse could have started at various floors starting at Floor 16 and below and produced the same behavior. It is our con-clusion that the collapse of WTC 7 was a global failure involving the near-simultaneous failureof all columns in the building and not a progressive collapse involving the sequential failure of columns throughout the building. "
RK: Yes, like also NST and I say: the bundle buckling. NIST´s video:
https://www.youtube.com/watch?v=fIAK6PAeyn8
FR: " Despite simulating a number of hypothetical scenarios, we were unable to identify any progressive sequence of failures that could have taken place on September 11, 2001, and caused a total collapse of the building, let alone the observed straight-down collapse with approximately 2.5 se conds of free fall and minimal differential movement of the exterior. "
RK: There was no free fall in structures: in the same time parly acceleratd and partly hindered faa is not free fall. NIST speaks abot "free lall speed" - which is a jounalistic mistake of some physically ignorant issue secretary practitioneer...
Kommentit